Benchmark (ONNX) for intermediate outputs of a MLPClassifier#
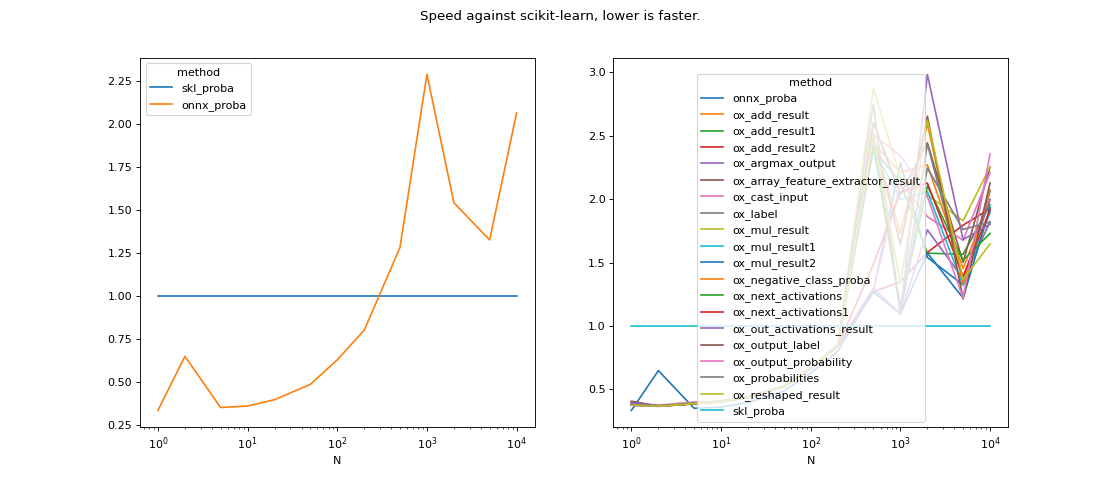
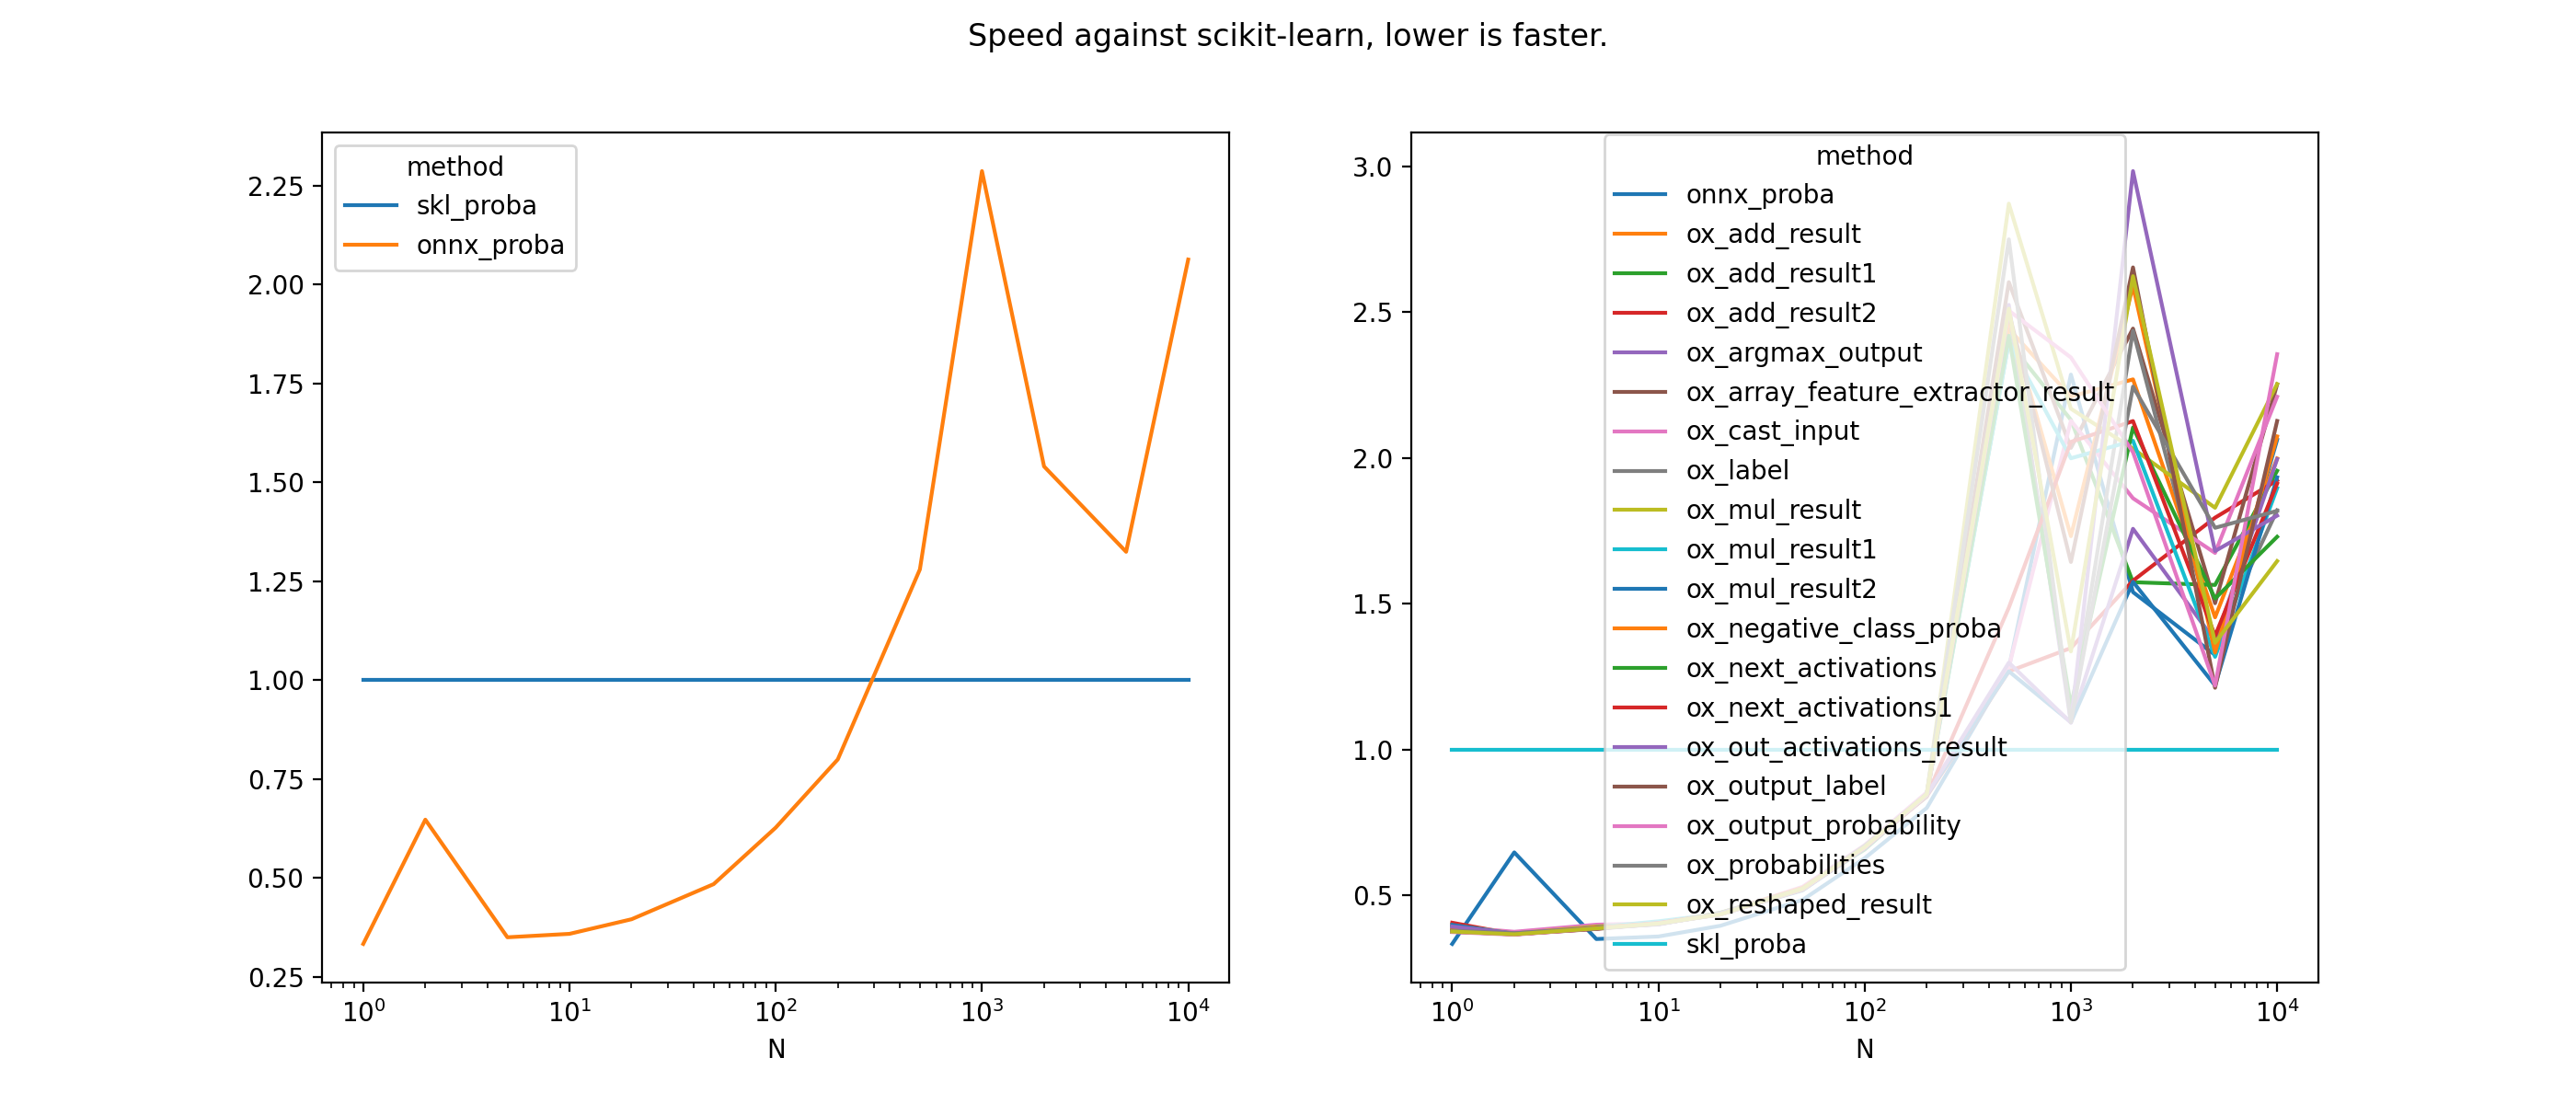
The experiment compares the execution time between for all intermediate nodes. The original graph is truncated from the input node to every intermediate node. The network was trained on a binary classification, it has 10 features, two layers with 10 networks each.
Overview#
(Source code, png, hires.png, pdf)

Configuration#
<<<
from pyquickhelper.pandashelper import df2rst
import pandas
name = os.path.join(
    __WD__, "../../onnx/results/bench_plot_onnxruntime_casc_mlp.time.csv")
df = pandas.read_csv(name)
print(df2rst(df, number_format=4))
>>>
name |
version |
value |
|---|---|---|
date |
2019-12-11 |
|
python |
3.7.2 (default, Mar 1 2019, 18:34:21) [GCC 6.3.0 20170516] |
|
platform |
linux |
|
OS |
Linux-4.9.0-8-amd64-x86_64-with-debian-9.6 |
|
machine |
x86_64 |
|
processor |
||
release |
4.9.0-8-amd64 |
|
architecture |
(‘64bit’, ‘’) |
|
mlprodict |
0.3 |
|
numpy |
1.17.4 |
openblas, language=c |
onnx |
1.6.34 |
opset=12 |
onnxruntime |
1.1.992 |
CPU-MKL-ML |
pandas |
0.25.3 |
|
skl2onnx |
1.6.992 |
|
sklearn |
0.22 |
Raw results#
bench_plot_onnxruntime_casc_mlp.csv
<<<
from pyquickhelper.pandashelper import df2rst
from pymlbenchmark.benchmark.bench_helper import bench_pivot
import pandas
name = os.path.join(
    __WD__, "../../onnx/results/bench_plot_onnxruntime_casc_mlp.perf.csv")
df = pandas.read_csv(name)
print(df2rst(df, number_format=4))
Benchmark code#
bench_plot_onnxruntime_casc_mlp.py
# coding: utf-8
"""
Benchmark of :epkg:`onnxruntime` to study time spent from beginning
to every node.
"""
# Authors: Xavier Dupré (benchmark)
# License: MIT
import matplotlib
matplotlib.use('Agg')

import os
import unittest
import warnings
import contextlib
from time import perf_counter as time
from io import StringIO
from collections import OrderedDict
import numpy
import pandas
import matplotlib.pyplot as plt
import sklearn
from sklearn.utils._testing import ignore_warnings
from sklearn.utils.extmath import softmax
from sklearn.neural_network import MLPClassifier
from pyquickhelper.loghelper import run_cmd, sys_path_append
from pymlbenchmark.benchmark import BenchPerfTest, BenchPerf, ProfilerCall
from pymlbenchmark.context import machine_information
from pymlbenchmark.datasets.artificial import random_binary_classification
from pymlbenchmark.plotting import plot_bench_results
from onnxruntime import InferenceSession
from mlprodict.onnx_tools.onnx_manipulations import enumerate_model_node_outputs
from mlprodict.sklapi import OnnxTransformer


################################
# Trains a MLPClassifier
# ++++++++++++++++++++++
#
# Training

fixed_dim = 10
X, y = random_binary_classification(N=10000, dim=fixed_dim)
model = MLPClassifier(hidden_layer_sizes=(10, 2), activation='logistic')
model.fit(X, y)

# Converting
from skl2onnx import to_onnx
model_onnx = to_onnx(model, X.astype(numpy.float32))
model_onnx.ir_version = get_ir_version(__max_supported_opset__)

##################################
# Display the ONNX graph
# ++++++++++++++++++++++

if not os.path.exists("pipeline_mlp.dot.png"):
    from onnx.tools.net_drawer import GetPydotGraph, GetOpNodeProducer
    pydot_graph = GetPydotGraph(model_onnx.graph, name=model_onnx.graph.name, rankdir="TB",
                                node_producer=GetOpNodeProducer("docstring", color="yellow",
                                                                fillcolor="yellow", style="filled"))
    pydot_graph.write_dot("pipeline_mlp.dot")

    import os
    os.system('dot -O -Gdpi=300 -Tpng pipeline_mlp.dot')

    import matplotlib.pyplot as plt
    image = plt.imread("pipeline_mlp.dot.png")
    fig, ax = plt.subplots(figsize=(40, 20))
    ax.imshow(image)
    ax.axis('off')

##################################
# Intermediate outputs
# ++++++++++++++++++++

output_names = list(enumerate_model_node_outputs(model_onnx))

##################################
# Bench definition
# ++++++++++++++++


class GraphORtBenchPerfTest(BenchPerfTest):

    def __init__(self, fixed_dim=None, skl_model=None,
                 model_onnx=None, **kwargs):
        BenchPerfTest.__init__(self, **kwargs)
        if fixed_dim is None:
            raise RuntimeError("fixed_dim cannot be None.")
        if skl_model is None:
            raise RuntimeError("skl_model cannot be None.")
        if model_onnx is None:
            raise RuntimeError("model_onnx cannot be None.")
        self.fixed_dim = fixed_dim
        self.skl_model = skl_model
        self.model_onnx = model_onnx

        output_names = list(enumerate_model_node_outputs(model_onnx))
        self.onnx_bytes = model_onnx.SerializeToString()

        models = OrderedDict()
        for name in output_names:
            models[name] = OnnxTransformer(self.onnx_bytes, name)
            models[name].fit()
        self.onnx_models = models

    def fcts(self, **kwargs):
        sess = InferenceSession(self.onnx_bytes)
        fcts = [{'lib': 'skl', 'method': 'skl_proba',
                 'fct': self.skl_model.predict},
                {'lib': 'ort', 'method': 'onnx_proba',
                 'fct': lambda X, sess=sess: sess.run(None, {'X': X.astype(numpy.float32)})[0]}]
        for k, v in self.onnx_models.items():
            def fct(X, onx=v.onnxrt_):
                out = onx.run({'X': X.astype(numpy.float32)})
                name = onx.output_names[0]
                return out[name]
            fcts.append(dict(lib='ort', method='ox_' + k, fct=fct))

        return fcts

    def data(self, N=10, dim=4, **kwargs):  # pylint: disable=W0221
        if self.fixed_dim != dim:
            raise RuntimeError(
                "Only dim={} is allowed not {}.".format(self.fixed_dim, dim))
        return tuple(o.astype(numpy.float32)
                     for o in random_binary_classification(N, dim)[:1])

#######################
# Run bench
# +++++++++


@ignore_warnings(category=FutureWarning)
def run_bench(repeat=25, number=20, verbose=False,
              fixed_dim=None, skl_model=None, model_onnx=None):

    pbefore = dict(dim=[fixed_dim],
                   fixed_dim=[fixed_dim],
                   skl_model=[skl_model],
                   model_onnx=[model_onnx])
    pafter = dict(N=[1, 2, 5, 10, 20, 50, 100, 200, 500,
                     1000, 2000, 5000, 10000
                     ])

    profilers = [ProfilerCall(dict(N=1, method="skl_proba"), module="cProfile"),
                 ProfilerCall(dict(N=1, method="onnx_proba"),
                              module="cProfile"),
                 ProfilerCall(dict(N=10, method="skl_proba")),
                 ProfilerCall(dict(N=10, method="onnx_proba")),
                 ]

    test = lambda dim=None, **opts: GraphORtBenchPerfTest(**opts)
    bp = BenchPerf(pbefore, pafter, test, profilers=profilers)

    with sklearn.config_context(assume_finite=True):
        start = time()
        results = list(bp.enumerate_run_benchs(repeat=repeat, verbose=verbose,
                                               number=number, stop_if_error=False))
        end = time()

    results_df = pandas.DataFrame(results)
    print("Total time = %0.3f sec\n" % (end - start))
    return results_df, profilers

#########################
# Runs the benchmark
# ++++++++++++++++++


filename = os.path.splitext(os.path.split(__file__)[-1])[0]
df, profilers = run_bench(verbose=True, fixed_dim=fixed_dim, skl_model=model,
                          model_onnx=model_onnx)
df = df.drop(['model_onnx', 'skl_model'], axis=1)
df.to_csv("%s.perf.csv" % filename, index=False)
print(df.head())

with open("%s.prof.txt" % filename, "w") as f:
    for prof in profilers:
        f.write("\n#########################################\n\n")
        prof.to_txt(f)

#########################
# Extract information about the machine used
# ++++++++++++++++++++++++++++++++++++++++++

pkgs = ['numpy', 'pandas', 'sklearn', 'skl2onnx', 'onnxruntime',
        'onnx', 'mlprodict']
dfi = pandas.DataFrame(machine_information(pkgs))
dfi.to_csv("%s.time.csv" % filename, index=False)
print(dfi)

#############################
# Plot the results by number of nodes
# +++++++++++++++++++++++++++++++++++

data = df[["N", "mean", "method"]].pivot('N', 'method', 'mean')
for c in data.columns:
    data[c] /= data['skl_proba']

fig, ax = plt.subplots(1, 2, figsize=(14, 6))
data[['skl_proba', 'onnx_proba']].plot(ax=ax[0])
data.plot(ax=ax[1])
fig.savefig("%s.graph.png" % filename)

import sys
if "--quiet" not in sys.argv:
    plt.show()