Note
Click here to download the full example code
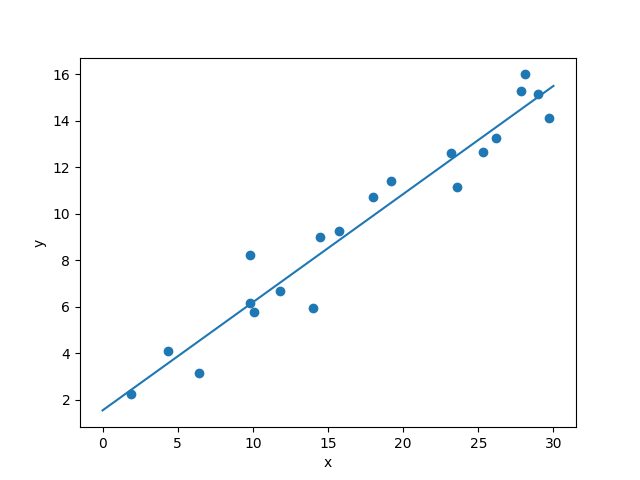
Simple Linear Regression#
See LinearRegression.
import numpy as np
import matplotlib.pyplot as plt
from sklearn.linear_model import LinearRegression


def plot_linear_regression():
    a = 0.5
    b = 1.0

    # x from 0 to 10
    x = 30 * np.random.random(20)

    # y = a*x + b with noise
    y = a * x + b + np.random.normal(size=x.shape)

    # create a linear regression classifier
    clf = LinearRegression()
    clf.fit(x[:, None], y)

    # predict y from the data
    x_new = np.linspace(0, 30, 100)
    y_new = clf.predict(x_new[:, None])

    # plot the results
    ax = plt.axes()
    ax.scatter(x, y)
    ax.plot(x_new, y_new)

    ax.set_xlabel('x')
    ax.set_ylabel('y')

    ax.axis('tight')


plot_linear_regression()
Total running time of the script: ( 0 minutes 2.326 seconds)