Note
Click here to download the full example code
Constraint KMeans#
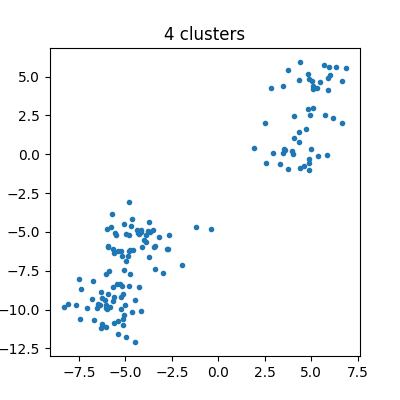
Simple example to show how to cluster keeping approximatively the same number of points in every cluster.
Data#
from collections import Counter
import numpy
import matplotlib.pyplot as plt
from sklearn.datasets import make_blobs
from sklearn.cluster import KMeans
from mlinsights.mlmodel import ConstraintKMeans


n_samples = 100
data = make_blobs(
    n_samples=n_samples, n_features=2, centers=2, cluster_std=1.0,
    center_box=(-10.0, 0.0), shuffle=True, random_state=2)
X1 = data[0]
data = make_blobs(
    n_samples=n_samples // 2, n_features=2, centers=2, cluster_std=1.0,
    center_box=(0.0, 10.0), shuffle=True, random_state=2)
X2 = data[0]

X = numpy.vstack([X1, X2])
X.shape
(150, 2)
Plots.
fig, ax = plt.subplots(1, 1, figsize=(4, 4))
ax.plot(X[:, 0], X[:, 1], '.')
ax.set_title('4 clusters')
Text(0.5, 1.0, '4 clusters')
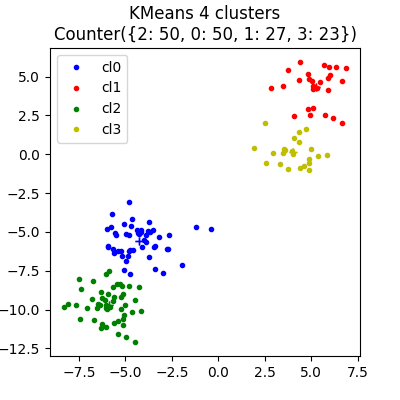
Standard KMeans#
km = KMeans(n_clusters=4)
km.fit(X)
cl = km.predict(X)
hist = Counter(cl)

colors = 'brgy'
fig, ax = plt.subplots(1, 1, figsize=(4, 4))
for i in range(0, max(cl) + 1):
    ax.plot(X[cl == i, 0], X[cl == i, 1], colors[i] + '.', label='cl%d' % i)
    x = [km.cluster_centers_[i, 0], km.cluster_centers_[i, 0]]
    y = [km.cluster_centers_[i, 1], km.cluster_centers_[i, 1]]
    ax.plot(x, y, colors[i] + '+')
ax.set_title(f'KMeans 4 clusters\n{hist!r}')
ax.legend()
<matplotlib.legend.Legend object at 0x7f0676941af0>
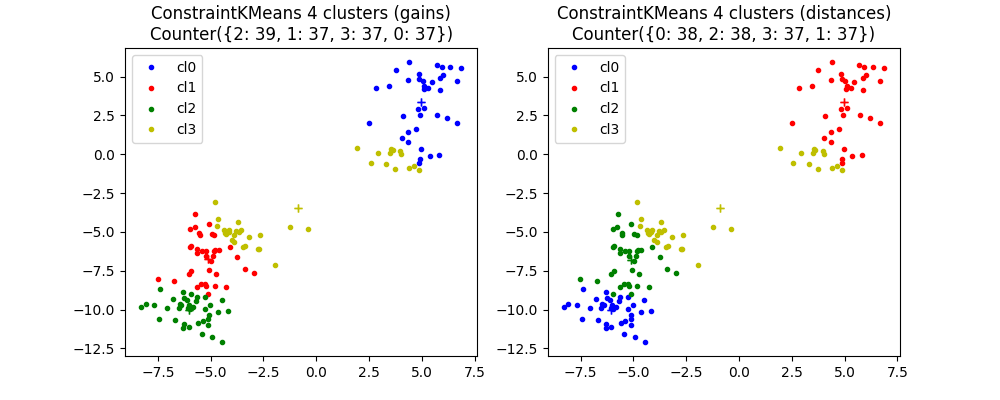
Constraint KMeans#
km1 = ConstraintKMeans(n_clusters=4, strategy='gain',
                       balanced_predictions=True)
km1.fit(X)

km2 = ConstraintKMeans(n_clusters=4, strategy='distance',
                       balanced_predictions=True)
km2.fit(X)
somewhere/workspace/mlinsights/mlinsights_UT_39_std/_venv/lib/python3.9/site-packages/sklearn/cluster/_kmeans.py:1316: FutureWarning: algorithm='auto' is deprecated, it will be removed in 1.3. Using 'lloyd' instead.
  warnings.warn(
somewhere/workspace/mlinsights/mlinsights_UT_39_std/_venv/lib/python3.9/site-packages/sklearn/cluster/_kmeans.py:1316: FutureWarning: algorithm='auto' is deprecated, it will be removed in 1.3. Using 'lloyd' instead.
  warnings.warn(
This algorithm tries to exchange points between clusters.
cl1 = km1.predict(X)
hist1 = Counter(cl1)

cl2 = km2.predict(X)
hist2 = Counter(cl2)

fig, ax = plt.subplots(1, 2, figsize=(10, 4))
for i in range(0, max(cl1) + 1):
    ax[0].plot(X[cl1 == i, 0], X[cl1 == i, 1],
               colors[i] + '.', label='cl%d' % i)
    ax[1].plot(X[cl2 == i, 0], X[cl2 == i, 1],
               colors[i] + '.', label='cl%d' % i)
    x = [km1.cluster_centers_[i, 0], km1.cluster_centers_[i, 0]]
    y = [km1.cluster_centers_[i, 1], km1.cluster_centers_[i, 1]]
    ax[0].plot(x, y, colors[i] + '+')
    x = [km2.cluster_centers_[i, 0], km2.cluster_centers_[i, 0]]
    y = [km2.cluster_centers_[i, 1], km2.cluster_centers_[i, 1]]
    ax[1].plot(x, y, colors[i] + '+')
ax[0].set_title(f'ConstraintKMeans 4 clusters (gains)\n{hist1!r}')
ax[0].legend()
ax[1].set_title(f'ConstraintKMeans 4 clusters (distances)\n{hist2!r}')
ax[1].legend()
<matplotlib.legend.Legend object at 0x7f0676804fd0>
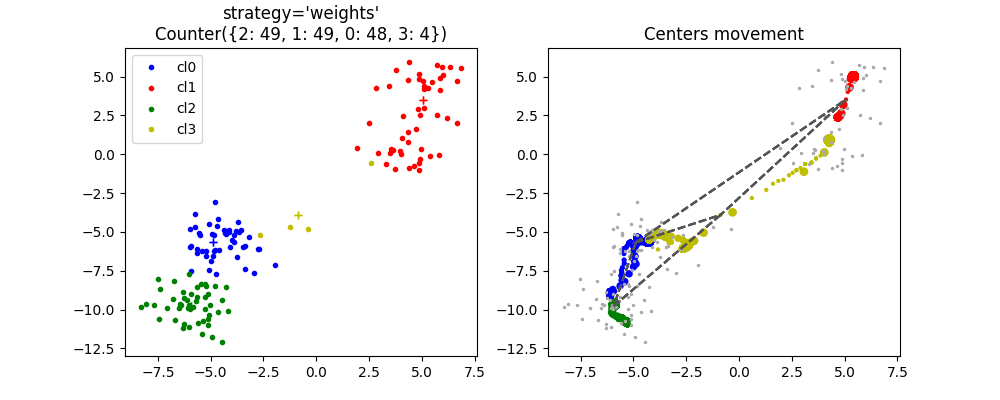
Another algorithm tries to extend the area of attraction of each cluster.
km = ConstraintKMeans(n_clusters=4, strategy='weights', max_iter=1000,
                      history=True)
km.fit(X)

cl = km.predict(X)
hist = Counter(cl)
somewhere/workspace/mlinsights/mlinsights_UT_39_std/_venv/lib/python3.9/site-packages/sklearn/cluster/_kmeans.py:1316: FutureWarning: algorithm='auto' is deprecated, it will be removed in 1.3. Using 'lloyd' instead.
  warnings.warn(
Let’s plot Delaunay edges as well.
def plot_delaunay(ax, edges, points):
    for a, b in edges:
        ax.plot(points[[a, b], 0], points[[a, b], 1], '--', color="#555555")


edges = km.cluster_edges()


fig, ax = plt.subplots(1, 2, figsize=(10, 4))
for i in range(0, max(cl) + 1):
    ax[0].plot(X[cl == i, 0], X[cl == i, 1], colors[i] + '.', label='cl%d' % i)
    x = [km.cluster_centers_[i, 0], km.cluster_centers_[i, 0]]
    y = [km.cluster_centers_[i, 1], km.cluster_centers_[i, 1]]
    ax[0].plot(x, y, colors[i] + '+')
ax[0].set_title(f"ConstraintKMeans 4 clusters\nstrategy='weights'\n{hist!r}")
ax[0].legend()

cls = km.cluster_centers_iter_
ax[1].plot(X[:, 0], X[:, 1], '.', label='X', color='#AAAAAA', ms=3)
for i in range(0, max(cl) + 1):
    ms = numpy.arange(
        cls.shape[-1]).astype(numpy.float64) / cls.shape[-1] * 50 + 1
    ax[1].scatter(cls[i, 0, :], cls[i, 1, :],
                  color=colors[i], s=ms, label='cl%d' % i)
    plot_delaunay(ax[1], edges, km.cluster_centers_)
ax[1].set_title("Centers movement")

plt.show()
Total running time of the script: ( 0 minutes 8.263 seconds)