Quantile MLPRegressor#
Links: notebook, html, PDF, python, slides, GitHub
scikit-learn does not have a
quantile regression for multi-layer perceptron.
mlinsights
implements a version of it based on the scikit-learn model. The
implementation overwrites method _backprop.
%matplotlib inline
import warnings
warnings.simplefilter("ignore")
We generate some dummy data.
import numpy
X = numpy.random.random(1000)
eps1 = (numpy.random.random(900) - 0.5) * 0.1
eps2 = (numpy.random.random(100)) * 10
eps = numpy.hstack([eps1, eps2])
X = X.reshape((1000, 1))
Y = X.ravel() * 3.4 + 5.6 + eps
from sklearn.neural_network import MLPRegressor
clr = MLPRegressor(hidden_layer_sizes=(30,), activation='tanh')
clr.fit(X, Y)
MLPRegressor(activation='tanh', hidden_layer_sizes=(30,))
from mlinsights.mlmodel import QuantileMLPRegressor
clq = QuantileMLPRegressor(hidden_layer_sizes=(30,), activation='tanh')
clq.fit(X, Y)
QuantileMLPRegressor(activation='tanh', hidden_layer_sizes=(30,))
from pandas import DataFrame
data= dict(X=X.ravel(), Y=Y, clr=clr.predict(X), clq=clq.predict(X))
df = DataFrame(data)
df.head()
| X | Y | clr | clq | |
|---|---|---|---|---|
| 0 | 0.251734 | 6.470634 | 7.059780 | 6.481283 |
| 1 | 0.538065 | 7.423694 | 8.029974 | 7.510084 |
| 2 | 0.530510 | 7.411181 | 8.006414 | 7.485186 |
| 3 | 0.048348 | 5.808051 | 6.278572 | 5.646920 |
| 4 | 0.882162 | 8.624456 | 8.986741 | 8.519049 |
import matplotlib.pyplot as plt
fig, ax = plt.subplots(1, 1, figsize=(10, 4))
choice = numpy.random.choice(X.shape[0]-1, size=100)
xx = X.ravel()[choice]
yy = Y[choice]
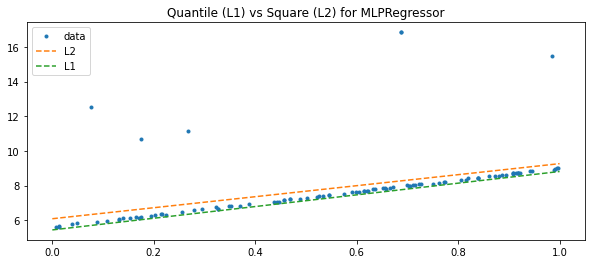
ax.plot(xx, yy, '.', label="data")
xx = numpy.array([[0], [1]])
y1 = clr.predict(xx)
y2 = clq.predict(xx)
ax.plot(xx, y1, "--", label="L2")
ax.plot(xx, y2, "--", label="L1")
ax.set_title("Quantile (L1) vs Square (L2) for MLPRegressor")
ax.legend();