Note
Click here to download the full example code
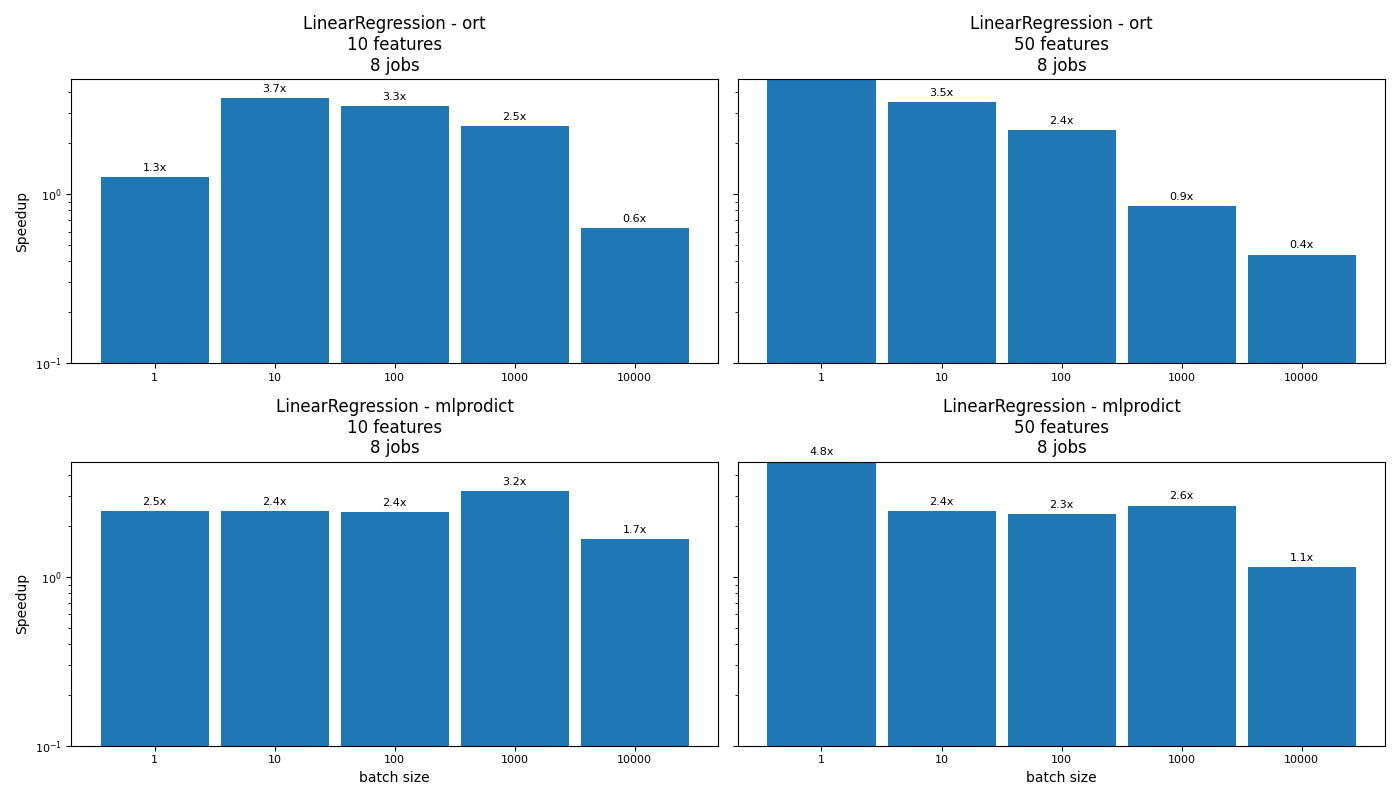
Benchmark Linear Regression#
The script compares different implementations for the operator LinearRegression.
baseline: LinearRegression from scikit-learn
ort: onnxruntime,
mlprodict: an implementation based on an array of structures, every structure describes a node,
Import#
import warnings
from time import perf_counter as time
from multiprocessing import cpu_count
import numpy
from numpy.random import rand
from numpy.testing import assert_almost_equal
import matplotlib.pyplot as plt
import pandas
from onnxruntime import InferenceSession
from sklearn import config_context
from sklearn.linear_model import LinearRegression
from sklearn.utils._testing import ignore_warnings
from skl2onnx import convert_sklearn
from skl2onnx.common.data_types import FloatTensorType
from mlprodict.onnxrt import OnnxInference
Available optimisation on this machine.
from mlprodict.testing.experimental_c_impl.experimental_c import code_optimisation
print(code_optimisation())
AVX-omp=8
Versions#
def version():
    from datetime import datetime
    import sklearn
    import numpy
    import onnx
    import onnxruntime
    import skl2onnx
    import mlprodict
    df = pandas.DataFrame([
        {"name": "date", "version": str(datetime.now())},
        {"name": "numpy", "version": numpy.__version__},
        {"name": "scikit-learn", "version": sklearn.__version__},
        {"name": "onnx", "version": onnx.__version__},
        {"name": "onnxruntime", "version": onnxruntime.__version__},
        {"name": "skl2onnx", "version": skl2onnx.__version__},
        {"name": "mlprodict", "version": mlprodict.__version__},
    ])
    return df


version()
Implementations to benchmark#
def fcts_model(X, y, n_jobs):
    "LinearRegression."
    model = LinearRegression(n_jobs=n_jobs)
    model.fit(X, y)

    initial_types = [('X', FloatTensorType([None, X.shape[1]]))]
    onx = convert_sklearn(model, initial_types=initial_types)
    sess = InferenceSession(onx.SerializeToString())
    outputs = [o.name for o in sess.get_outputs()]
    oinf = OnnxInference(onx, runtime="python")

    def predict_skl_predict(X, model=model):
        return model.predict(X)

    def predict_onnxrt_predict(X, sess=sess):
        return sess.run(outputs[:1], {'X': X})[0]

    def predict_onnx_inference(X, oinf=oinf):
        return oinf.run({'X': X})["variable"]

    return {'predict': (
        predict_skl_predict, predict_onnxrt_predict,
        predict_onnx_inference)}
Benchmarks#
def allow_configuration(**kwargs):
    return True


def bench(n_obs, n_features, n_jobss,
          methods, repeat=10, verbose=False):
    res = []
    for nfeat in n_features:

        ntrain = 50000
        X_train = numpy.empty((ntrain, nfeat)).astype(numpy.float32)
        X_train[:, :] = rand(ntrain, nfeat)[:, :]
        eps = rand(ntrain) - 0.5
        y_train = X_train.sum(axis=1) + eps

        for n_jobs in n_jobss:
            fcts = fcts_model(X_train, y_train, n_jobs)

            for n in n_obs:
                for method in methods:

                    fct1, fct2, fct3 = fcts[method]

                    if not allow_configuration(n=n, nfeat=nfeat,
                                               n_jobs=n_jobs, method=method):
                        continue

                    obs = dict(n_obs=n, nfeat=nfeat, method=method,
                               n_jobs=n_jobs)

                    # creates different inputs to avoid caching in any ways
                    Xs = []
                    for r in range(repeat):
                        x = numpy.empty((n, nfeat))
                        x[:, :] = rand(n, nfeat)[:, :]
                        Xs.append(x.astype(numpy.float32))

                    # measures the baseline
                    with config_context(assume_finite=True):
                        st = time()
                        repeated = 0
                        for X in Xs:
                            p1 = fct1(X)
                            repeated += 1
                            if time() - st >= 1:
                                break  # stops if longer than a second
                        end = time()
                        obs["time_skl"] = (end - st) / repeated

                    # measures the new implementation
                    st = time()
                    r2 = 0
                    for X in Xs:
                        p2 = fct2(X)
                        r2 += 1
                        if r2 >= repeated:
                            break
                    end = time()
                    obs["time_ort"] = (end - st) / r2

                    # measures the other new implementation
                    st = time()
                    r2 = 0
                    for X in Xs:
                        p2 = fct3(X)
                        r2 += 1
                        if r2 >= repeated:
                            break
                    end = time()
                    obs["time_mlprodict"] = (end - st) / r2

                    # final
                    res.append(obs)
                    if verbose and (len(res) % 1 == 0 or n >= 10000):
                        print("bench", len(res), ":", obs)

                    # checks that both produce the same outputs
                    if n <= 10000:
                        if len(p1.shape) == 1 and len(p2.shape) == 2:
                            p2 = p2.ravel()
                        try:
                            assert_almost_equal(
                                p1.ravel(), p2.ravel(), decimal=5)
                        except AssertionError as e:
                            warnings.warn(str(e))
    return res
Graphs#
def plot_rf_models(dfr):

    def autolabel(ax, rects):
        for rect in rects:
            height = rect.get_height()
            ax.annotate(f'{height:1.1f}x',
                        xy=(rect.get_x() + rect.get_width() / 2, height),
                        xytext=(0, 3),  # 3 points vertical offset
                        textcoords="offset points",
                        ha='center', va='bottom',
                        fontsize=8)

    engines = [_.split('_')[-1] for _ in dfr.columns if _.startswith("time_")]
    engines = [_ for _ in engines if _ != 'skl']
    for engine in engines:
        dfr[f"speedup_{engine}"] = dfr["time_skl"] / dfr[f"time_{engine}"]
    print(dfr.tail().T)

    ncols = 2
    fig, axs = plt.subplots(len(engines), ncols, figsize=(
        14, 4 * len(engines)), sharey=True)

    row = 0
    for row, engine in enumerate(engines):
        pos = 0
        name = f"LinearRegression - {engine}"
        for nf in sorted(set(dfr.nfeat)):
            for n_jobs in sorted(set(dfr.n_jobs)):
                sub = dfr[(dfr.nfeat == nf) & (dfr.n_jobs == n_jobs)]
                ax = axs[row, pos]
                labels = sub.n_obs
                means = sub[f"speedup_{engine}"]

                x = numpy.arange(len(labels))
                width = 0.90

                rects1 = ax.bar(x, means, width, label='Speedup')
                if pos == 0:
                    ax.set_yscale('log')
                    ax.set_ylim([0.1, max(dfr[f"speedup_{engine}"])])

                if pos == 0:
                    ax.set_ylabel('Speedup')
                ax.set_title('%s\n%d features\n%d jobs' % (name, nf, n_jobs))
                if row == len(engines) - 1:
                    ax.set_xlabel('batch size')
                ax.set_xticks(x)
                ax.set_xticklabels(labels)
                autolabel(ax, rects1)
                for tick in ax.xaxis.get_major_ticks():
                    tick.label.set_fontsize(8)
                for tick in ax.yaxis.get_major_ticks():
                    tick.label.set_fontsize(8)
                pos += 1

    fig.tight_layout()
    return fig, ax
Run benchs#
@ignore_warnings(category=FutureWarning)
def run_bench(repeat=250, verbose=False):
    n_obs = [1, 10, 100, 1000, 10000]
    methods = ['predict']
    n_features = [10, 50]
    n_jobss = [cpu_count()]

    start = time()
    results = bench(n_obs, n_features, n_jobss,
                    methods, repeat=repeat, verbose=verbose)
    end = time()

    results_df = pandas.DataFrame(results)
    print("Total time = %0.3f sec cpu=%d\n" % (end - start, cpu_count()))

    # plot the results
    return results_df


name = "plot_linear_regression"
df = run_bench(verbose=True)
df.to_csv(f"{name}.csv", index=False)
df.to_excel(f"{name}.xlsx", index=False)
fig, ax = plot_rf_models(df)
fig.savefig(f"{name}.png")
plt.show()
bench 1 : {'n_obs': 1, 'nfeat': 10, 'method': 'predict', 'n_jobs': 8, 'time_skl': 0.0001481182803399861, 'time_ort': 0.00011684072390198707, 'time_mlprodict': 6.014802400022745e-05}
bench 2 : {'n_obs': 10, 'nfeat': 10, 'method': 'predict', 'n_jobs': 8, 'time_skl': 0.0001467620558105409, 'time_ort': 3.9624431636184455e-05, 'time_mlprodict': 6.0010224115103486e-05}
bench 3 : {'n_obs': 100, 'nfeat': 10, 'method': 'predict', 'n_jobs': 8, 'time_skl': 0.0001482546399347484, 'time_ort': 4.479817999526858e-05, 'time_mlprodict': 6.149373203516007e-05}
bench 4 : {'n_obs': 1000, 'nfeat': 10, 'method': 'predict', 'n_jobs': 8, 'time_skl': 0.0002465759557671845, 'time_ort': 9.749664412811398e-05, 'time_mlprodict': 7.640941999852658e-05}
bench 5 : {'n_obs': 10000, 'nfeat': 10, 'method': 'predict', 'n_jobs': 8, 'time_skl': 0.0002564993319101632, 'time_ort': 0.00040586764412000773, 'time_mlprodict': 0.00015348862810060383}
bench 6 : {'n_obs': 1, 'nfeat': 50, 'method': 'predict', 'n_jobs': 8, 'time_skl': 0.00029003746807575225, 'time_ort': 4.470650386065245e-05, 'time_mlprodict': 6.038074381649494e-05}
bench 7 : {'n_obs': 10, 'nfeat': 50, 'method': 'predict', 'n_jobs': 8, 'time_skl': 0.0001472740122117102, 'time_ort': 4.180376790463924e-05, 'time_mlprodict': 6.030078418552876e-05}
bench 8 : {'n_obs': 100, 'nfeat': 50, 'method': 'predict', 'n_jobs': 8, 'time_skl': 0.00015256707603111862, 'time_ort': 6.377387186512351e-05, 'time_mlprodict': 6.509249564260245e-05}
bench 9 : {'n_obs': 1000, 'nfeat': 50, 'method': 'predict', 'n_jobs': 8, 'time_skl': 0.00024230495607480406, 'time_ort': 0.00028393073193728926, 'time_mlprodict': 9.187086019665003e-05}
bench 10 : {'n_obs': 10000, 'nfeat': 50, 'method': 'predict', 'n_jobs': 8, 'time_skl': 0.00048492022790014744, 'time_ort': 0.0011058347118087113, 'time_mlprodict': 0.0004271069038659334}
Total time = 6.560 sec cpu=8

                          5         6         7         8         9
n_obs                     1        10       100      1000     10000
nfeat                    50        50        50        50        50
method              predict   predict   predict   predict   predict
n_jobs                    8         8         8         8         8
time_skl            0.00029  0.000147  0.000153  0.000242  0.000485
time_ort           0.000045  0.000042  0.000064  0.000284  0.001106
time_mlprodict      0.00006   0.00006  0.000065  0.000092  0.000427
speedup_ort         6.48759  3.522984  2.392313  0.853395  0.438511
speedup_mlprodict  4.803476  2.442323   2.34385  2.637452   1.13536
somewhere/workspace/mlprodict/mlprodict_UT_39_std/_doc/examples/plot_opml_linear_regression.py:247: MatplotlibDeprecationWarning: The label function was deprecated in Matplotlib 3.1 and will be removed in 3.8. Use Tick.label1 instead.
  tick.label.set_fontsize(8)
somewhere/workspace/mlprodict/mlprodict_UT_39_std/_doc/examples/plot_opml_linear_regression.py:249: MatplotlibDeprecationWarning: The label function was deprecated in Matplotlib 3.1 and will be removed in 3.8. Use Tick.label1 instead.
  tick.label.set_fontsize(8)
Total running time of the script: ( 0 minutes 9.633 seconds)