Profiling with onnxruntime#
Links: notebook, html, PDF, python, slides, GitHub
The notebook profiles the execution of an ONNX graph built from a KMeans model and executed with onnxruntime. It then study the decomposition of one einsum equation into more simple operators.
from jyquickhelper import add_notebook_menu
add_notebook_menu()
%matplotlib inline
%load_ext mlprodict
KMeans#
Builds a KMeans#
from sklearn.datasets import make_classification
X, y = make_classification(100000)
from sklearn.cluster import KMeans
km = KMeans(max_iter=10)
km.fit(X)
KMeans(max_iter=10)
import numpy
from mlprodict.onnx_conv import to_onnx
onx = to_onnx(km, X[:1].astype(numpy.float32))
%onnxview onx
Json#
Another way to look into a model.
from mlprodict.onnxrt import OnnxInference

oinf = OnnxInference(onx)
js = oinf.to_json()
import json
from io import StringIO
from jyquickhelper import JSONJS
JSONJS(json.load(StringIO(oinf.to_json())))
Profiling#
from mlprodict.onnxrt import OnnxInference

oinf = OnnxInference(onx, runtime="onnxruntime1",
                     runtime_options={"enable_profiling": True})
for i in range(0, 111):
    oinf.run({"X": X.astype(numpy.float32)})
df = oinf.get_profiling(as_df=True)
df
| cat | pid | tid | dur | ts | ph | name | args_op_name | args_provider | args_graph_index | args_parameter_size | args_thread_scheduling_stats | args_exec_plan_index | args_activation_size | args_output_size | |
|---|---|---|---|---|---|---|---|---|---|---|---|---|---|---|---|
| 0 | Session | 106368 | 299276 | 596 | 12 | X | model_loading_array | NaN | NaN | NaN | NaN | NaN | NaN | NaN | NaN |
| 1 | Session | 106368 | 299276 | 6925 | 670 | X | session_initialization | NaN | NaN | NaN | NaN | NaN | NaN | NaN | NaN |
| 2 | Node | 106368 | 299276 | 1 | 34854 | X | Re_ReduceSumSquare_fence_before | ReduceSumSquare | NaN | NaN | NaN | NaN | NaN | NaN | NaN |
| 3 | Node | 106368 | 299276 | 2939 | 34869 | X | Re_ReduceSumSquare_kernel_time | ReduceSumSquare | CPUExecutionProvider | 0 | 0 | {'main_thread': {'thread_pool_name': 'session-... | 0 | 8000000 | 400000 |
| 4 | Node | 106368 | 299276 | 0 | 37872 | X | Re_ReduceSumSquare_fence_after | ReduceSumSquare | NaN | NaN | NaN | NaN | NaN | NaN | NaN |
| ... | ... | ... | ... | ... | ... | ... | ... | ... | ... | ... | ... | ... | ... | ... | ... |
| 2550 | Node | 106368 | 299276 | 0 | 2394227 | X | Ar_ArgMin_fence_before | ArgMin | NaN | NaN | NaN | NaN | NaN | NaN | NaN |
| 2551 | Node | 106368 | 299276 | 3511 | 2394228 | X | Ar_ArgMin_kernel_time | ArgMin | CPUExecutionProvider | 5 | 0 | {'main_thread': {'thread_pool_name': 'session-... | 5 | 3200000 | 800000 |
| 2552 | Node | 106368 | 299276 | 0 | 2397761 | X | Ar_ArgMin_fence_after | ArgMin | NaN | NaN | NaN | NaN | NaN | NaN | NaN |
| 2553 | Session | 106368 | 299276 | 11774 | 2385990 | X | SequentialExecutor::Execute | NaN | NaN | NaN | NaN | NaN | NaN | NaN | NaN |
| 2554 | Session | 106368 | 299276 | 11789 | 2385982 | X | model_run | NaN | NaN | NaN | NaN | NaN | NaN | NaN | NaN |
2555 rows × 15 columns
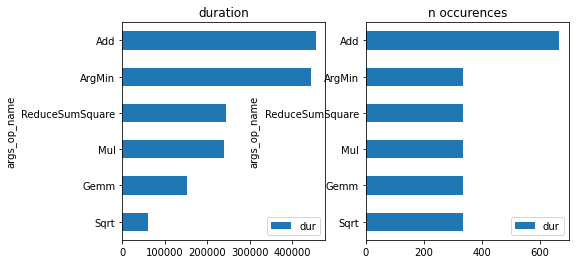
import matplotlib.pyplot as plt
gr_dur = df[['dur', "args_op_name"]].groupby("args_op_name").sum().sort_values('dur')
gr_n = df[['dur', "args_op_name"]].groupby("args_op_name").count().sort_values('dur')
gr_n = gr_n.loc[gr_dur.index, :]

fig, ax = plt.subplots(1, 2, figsize=(8, 4))
gr_dur.plot.barh(ax=ax[0])
gr_n.plot.barh(ax=ax[1])
ax[0].set_title("duration")
ax[1].set_title("n occurences");
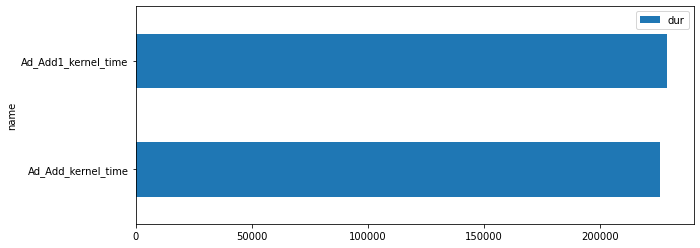
gr2 = df.loc[(df.args_op_name == 'Add') & (df.dur > 10), ['dur', "name"]].groupby("name").sum().sort_values('dur')
gr2.plot.barh(figsize=(10, 4));
onnxruntime#
from onnxruntime import InferenceSession, RunOptions, SessionOptions
so = SessionOptions()
so.enable_profiling = True
sess = InferenceSession(onx.SerializeToString(), so)
for i in range(0, 111):
    sess.run(None, {'X': X.astype(numpy.float32)}, )
prof = sess.end_profiling()
prof
'onnxruntime_profile__2021-05-13_13-58-59.json'
with open(prof, "r") as f:
    js = json.load(f)

js[:3]
[{'cat': 'Session',
  'pid': 106368,
  'tid': 299276,
  'dur': 450,
  'ts': 6,
  'ph': 'X',
  'name': 'model_loading_array',
  'args': {}},
 {'cat': 'Session',
  'pid': 106368,
  'tid': 299276,
  'dur': 3068,
  'ts': 498,
  'ph': 'X',
  'name': 'session_initialization',
  'args': {}},
 {'cat': 'Node',
  'pid': 106368,
  'tid': 299276,
  'dur': 1,
  'ts': 39069,
  'ph': 'X',
  'name': 'Re_ReduceSumSquare_fence_before',
  'args': {'op_name': 'ReduceSumSquare'}}]
from pandas import DataFrame
from mlprodict.onnxrt.ops_whole.session import OnnxWholeSession

df = DataFrame(OnnxWholeSession.process_profiling(js))
df
| cat | pid | tid | dur | ts | ph | name | args_op_name | args_provider | args_graph_index | args_parameter_size | args_thread_scheduling_stats | args_exec_plan_index | args_activation_size | args_output_size | |
|---|---|---|---|---|---|---|---|---|---|---|---|---|---|---|---|
| 0 | Session | 106368 | 299276 | 450 | 6 | X | model_loading_array | NaN | NaN | NaN | NaN | NaN | NaN | NaN | NaN |
| 1 | Session | 106368 | 299276 | 3068 | 498 | X | session_initialization | NaN | NaN | NaN | NaN | NaN | NaN | NaN | NaN |
| 2 | Node | 106368 | 299276 | 1 | 39069 | X | Re_ReduceSumSquare_fence_before | ReduceSumSquare | NaN | NaN | NaN | NaN | NaN | NaN | NaN |
| 3 | Node | 106368 | 299276 | 2804 | 39081 | X | Re_ReduceSumSquare_kernel_time | ReduceSumSquare | CPUExecutionProvider | 0 | 0 | {'main_thread': {'thread_pool_name': 'session-... | 0 | 8000000 | 400000 |
| 4 | Node | 106368 | 299276 | 0 | 41947 | X | Re_ReduceSumSquare_fence_after | ReduceSumSquare | NaN | NaN | NaN | NaN | NaN | NaN | NaN |
| ... | ... | ... | ... | ... | ... | ... | ... | ... | ... | ... | ... | ... | ... | ... | ... |
| 2550 | Node | 106368 | 299276 | 0 | 2530548 | X | Ar_ArgMin_fence_before | ArgMin | NaN | NaN | NaN | NaN | NaN | NaN | NaN |
| 2551 | Node | 106368 | 299276 | 3501 | 2530550 | X | Ar_ArgMin_kernel_time | ArgMin | CPUExecutionProvider | 5 | 0 | {'main_thread': {'thread_pool_name': 'session-... | 5 | 3200000 | 800000 |
| 2552 | Node | 106368 | 299276 | 0 | 2534074 | X | Ar_ArgMin_fence_after | ArgMin | NaN | NaN | NaN | NaN | NaN | NaN | NaN |
| 2553 | Session | 106368 | 299276 | 14679 | 2519397 | X | SequentialExecutor::Execute | NaN | NaN | NaN | NaN | NaN | NaN | NaN | NaN |
| 2554 | Session | 106368 | 299276 | 14701 | 2519386 | X | model_run | NaN | NaN | NaN | NaN | NaN | NaN | NaN | NaN |
2555 rows × 15 columns
Einsum: bsnh,btnh->bnts#
This section looks into the ONNX graph produces by the decomposition of an einsum equation into more simple ONNX operator (no einsum).
Three implementations#
from mlprodict.testing.einsum import einsum as onx_einsum
from mlprodict.testing.einsum.einsum_fct import _einsum, enumerate_cached_einsum
from numpy import einsum as np_einsum
First classic numpy.
equation = "bsnh,btnh->bnts"

N = 2
inputs = [numpy.random.randn(N, N, N, N).astype(numpy.float32),
          numpy.random.randn(N, N, N, N).astype(numpy.float32)]
np_einsum(equation, *inputs)
array([[[[-2.373884  , -0.63942796],
         [ 1.0523143 ,  5.659873  ]],
        [[ 2.589915  , -0.18050319],
         [-0.6200199 ,  3.793615  ]]],

       [[[-0.37409338,  0.19822143],
         [ 1.2049038 ,  3.1882448 ]],
        [[-0.05218329,  0.87404007],
         [ 0.12789296,  1.4745121 ]]]], dtype=float32)
Then einsum executed by onnxruntime:
onx_einsum(equation, *inputs, runtime='onnxruntime1', optimize=True, verbose=1, decompose=False)
0.0026 best='sbhn,sthn->shtb': 100%|██████████| 121/121 [00:01<00:00, 85.29it/s]
array([[[[-2.373884  , -0.63942796],
         [ 1.0523144 ,  5.659873  ]],

        [[ 2.589915  , -0.18050319],
         [-0.62002003,  3.793615  ]]],


       [[[-0.37409338,  0.19822143],
         [ 1.2049038 ,  3.1882448 ]],

        [[-0.05218329,  0.87404007],
         [ 0.12789296,  1.474512  ]]]], dtype=float32)
obj = _einsum(equation, runtime='onnxruntime1', optimize=True, verbose=1,
              decompose=False, dtype=inputs[0].dtype)
%onnxview obj.onnx_
Same equation but decomposed.
obj = _einsum(equation, runtime='onnxruntime1', optimize=True, verbose=1,
              decompose=True, dtype=inputs[0].dtype)
0.0025 best='hsnt,hbnt->hnbs': 100%|██████████| 121/121 [00:03<00:00, 34.54it/s]
%onnxview obj.onnx_
onx_einsum(equation, *inputs, runtime='onnxruntime1', optimize=True, verbose=1)
array([[[[-2.373884  , -0.63942796],
         [ 1.0523144 ,  5.659873  ]],
        [[ 2.589915  , -0.18050319],
         [-0.62002003,  3.793615  ]]],

       [[[-0.37409338,  0.19822143],
         [ 1.2049038 ,  3.1882448 ]],
        [[-0.05218329,  0.87404007],
         [ 0.12789296,  1.474512  ]]]], dtype=float32)
First benchmark#
N = 20
inputs = [numpy.random.randn(N, N, N, N).astype(numpy.float32),
          numpy.random.randn(N, N, N, N).astype(numpy.float32)]
numpy.einsum
%timeit numpy.einsum(equation, *inputs)
4.14 ms ± 350 µs per loop (mean ± std. dev. of 7 runs, 100 loops each)
onnxruntime einsum
%timeit onx_einsum(equation, *inputs, runtime='onnxruntime1', optimize=True, verbose=1, decompose=False)
736 µs ± 11.2 µs per loop (mean ± std. dev. of 7 runs, 1000 loops each)
onnxruntime decomposed einsum
%timeit onx_einsum(equation, *inputs, runtime='onnxruntime1', optimize=True, verbose=1)
525 µs ± 12.4 µs per loop (mean ± std. dev. of 7 runs, 1000 loops each)
Let’s disable the optimization to see the difference. The optimization goes through all the permutation of the letters of the equation and compares the computation time to find the best one.
%timeit onx_einsum(equation, *inputs, runtime='onnxruntime1', optimize=False, verbose=1, decompose=False)
761 µs ± 46.2 µs per loop (mean ± std. dev. of 7 runs, 1000 loops each)
It has no significant impact here but it has for the decomposition. The not optimized version is much slower.
%timeit onx_einsum(equation, *inputs, runtime='onnxruntime1', optimize=False, verbose=1)
1.41 ms ± 43.1 µs per loop (mean ± std. dev. of 7 runs, 1000 loops each)
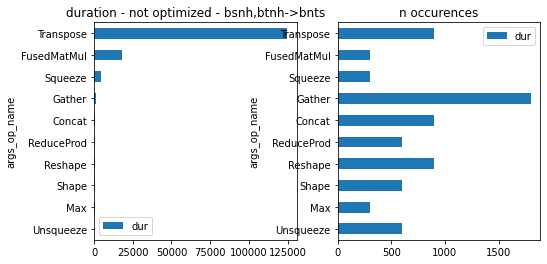
Profiling of the not optimized version#
Let’s profile the graph obtained with the decomposition.
obj = _einsum(equation, runtime='onnxruntime1', optimize=False, verbose=1,
              decompose=True, dtype=inputs[0].dtype)
onx = obj.onnx_
obj.equation, obj.equation_
('bsnh,btnh->bnts', 'bsnh,btnh->bnts')
from mlprodict.onnxrt import OnnxInference

oinf = OnnxInference(onx, runtime="onnxruntime1",
                     runtime_options={"enable_profiling": True})

d_inputs = {'X0': inputs[0], 'X1': inputs[1]}
for i in range(0, 100):
    oinf.run(d_inputs)

df = oinf.get_profiling(as_df=True)
df.head()
| cat | pid | tid | dur | ts | ph | name | args_op_name | args_provider | args_graph_index | args_parameter_size | args_thread_scheduling_stats | args_exec_plan_index | args_activation_size | args_output_size | |
|---|---|---|---|---|---|---|---|---|---|---|---|---|---|---|---|
| 0 | Session | 106368 | 299276 | 705 | 4 | X | model_loading_array | NaN | NaN | NaN | NaN | NaN | NaN | NaN | NaN |
| 1 | Session | 106368 | 299276 | 7019 | 987 | X | session_initialization | NaN | NaN | NaN | NaN | NaN | NaN | NaN | NaN |
| 2 | Node | 106368 | 299276 | 1 | 8320 | X | Unsqueeze3_2620928306480_fence_before | Unsqueeze | NaN | NaN | NaN | NaN | NaN | NaN | NaN |
| 3 | Node | 106368 | 299276 | 4 | 8327 | X | Unsqueeze3_2620928306480_kernel_time | Unsqueeze | CPUExecutionProvider | 4 | 8 | {'main_thread': {'thread_pool_name': 'session-... | 4 | 640000 | 640000 |
| 4 | Node | 106368 | 299276 | 0 | 8372 | X | Unsqueeze3_2620928306480_fence_after | Unsqueeze | NaN | NaN | NaN | NaN | NaN | NaN | NaN |
import matplotlib.pyplot as plt
gr_dur = df[['dur', "args_op_name"]].groupby("args_op_name").sum().sort_values('dur')
gr_n = df[['dur', "args_op_name"]].groupby("args_op_name").count().sort_values('dur')
gr_n = gr_n.loc[gr_dur.index, :]

fig, ax = plt.subplots(1, 2, figsize=(8, 4))
gr_dur.plot.barh(ax=ax[0])
gr_n.plot.barh(ax=ax[1])
ax[0].set_title("duration - not optimized - %s" % obj.equation_)
ax[1].set_title("n occurences");
Profiling of the optimized version#
obj = _einsum(equation, runtime='onnxruntime1', optimize=True, verbose=1,
              decompose=True, dtype=inputs[0].dtype)
onx = obj.onnx_
obj.equation, obj.equation_
('bsnh,btnh->bnts', 'hsnt,hbnt->hnbs')
The second equation is the optimized equation.
from mlprodict.onnxrt import OnnxInference

oinf = OnnxInference(onx, runtime="onnxruntime1",
                     runtime_options={"enable_profiling": True})

d_inputs = {'X0': inputs[0], 'X1': inputs[1]}
for i in range(0, 100):
    oinf.run(d_inputs)

df = oinf.get_profiling(as_df=True)
df.head()
| cat | pid | tid | dur | ts | ph | name | args_op_name | args_provider | args_graph_index | args_parameter_size | args_thread_scheduling_stats | args_exec_plan_index | args_activation_size | args_output_size | |
|---|---|---|---|---|---|---|---|---|---|---|---|---|---|---|---|
| 0 | Session | 106368 | 299276 | 1300 | 6 | X | model_loading_array | NaN | NaN | NaN | NaN | NaN | NaN | NaN | NaN |
| 1 | Session | 106368 | 299276 | 7330 | 1720 | X | session_initialization | NaN | NaN | NaN | NaN | NaN | NaN | NaN | NaN |
| 2 | Node | 106368 | 299276 | 1 | 9376 | X | Unsqueeze3_2620928202160_fence_before | Unsqueeze | NaN | NaN | NaN | NaN | NaN | NaN | NaN |
| 3 | Node | 106368 | 299276 | 4 | 9383 | X | Unsqueeze3_2620928202160_kernel_time | Unsqueeze | CPUExecutionProvider | 4 | 8 | {'main_thread': {'thread_pool_name': 'session-... | 4 | 640000 | 640000 |
| 4 | Node | 106368 | 299276 | 0 | 9422 | X | Unsqueeze3_2620928202160_fence_after | Unsqueeze | NaN | NaN | NaN | NaN | NaN | NaN | NaN |
gr_dur = df[['dur', "args_op_name"]].groupby("args_op_name").sum().sort_values('dur')
gr_n = df[['dur', "args_op_name"]].groupby("args_op_name").count().sort_values('dur')
gr_n = gr_n.loc[gr_dur.index, :]

fig, ax = plt.subplots(1, 2, figsize=(8, 4))
gr_dur.plot.barh(ax=ax[0])
gr_n.plot.barh(ax=ax[1])
ax[0].set_title("duration - optimized - %s" % obj.equation_)
ax[1].set_title("n occurences");
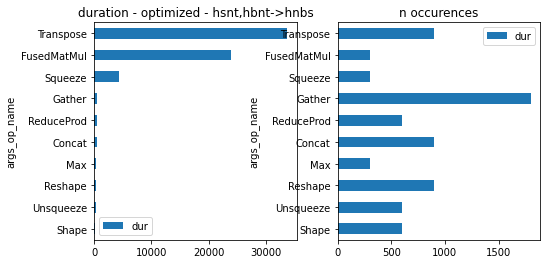
onnxruntime was able to fuse MatMul with a transposition. That explains why it is faster.
gr_dur = df[['dur', "args_op_name", "name"]].groupby(["args_op_name", "name"], as_index=False).sum().sort_values('dur')
gr_dur
| args_op_name | name | dur | |
|---|---|---|---|
| 0 | Concat | Concat12_fence_after | 0 |
| 24 | Gather | Gather1_fence_after | 0 |
| 25 | Gather | Gather1_fence_before | 0 |
| 27 | Gather | Gather_fence_after | 0 |
| 60 | Transpose | Transpose02134_2620928192768_fence_after | 0 |
| ... | ... | ... | ... |
| 56 | Squeeze | Squeeze4_2620928194352_kernel_time | 4339 |
| 59 | Transpose | Transpose01324_2620928151024_kernel_time | 8661 |
| 62 | Transpose | Transpose02134_2620928192768_kernel_time | 11487 |
| 65 | Transpose | Transpose13024_2620928192816_kernel_time | 13598 |
| 11 | FusedMatMul | MatMul_With_Transpose_kernel_time | 23847 |
72 rows × 3 columns
gr_dur[gr_dur.args_op_name == "Transpose"]
| args_op_name | name | dur | |
|---|---|---|---|
| 60 | Transpose | Transpose02134_2620928192768_fence_after | 0 |
| 57 | Transpose | Transpose01324_2620928151024_fence_after | 0 |
| 61 | Transpose | Transpose02134_2620928192768_fence_before | 0 |
| 58 | Transpose | Transpose01324_2620928151024_fence_before | 1 |
| 64 | Transpose | Transpose13024_2620928192816_fence_before | 1 |
| 63 | Transpose | Transpose13024_2620928192816_fence_after | 3 |
| 59 | Transpose | Transpose01324_2620928151024_kernel_time | 8661 |
| 62 | Transpose | Transpose02134_2620928192768_kernel_time | 11487 |
| 65 | Transpose | Transpose13024_2620928192816_kernel_time | 13598 |
Let’s draw again the graph to see which transpose is is which.
%onnxview onx
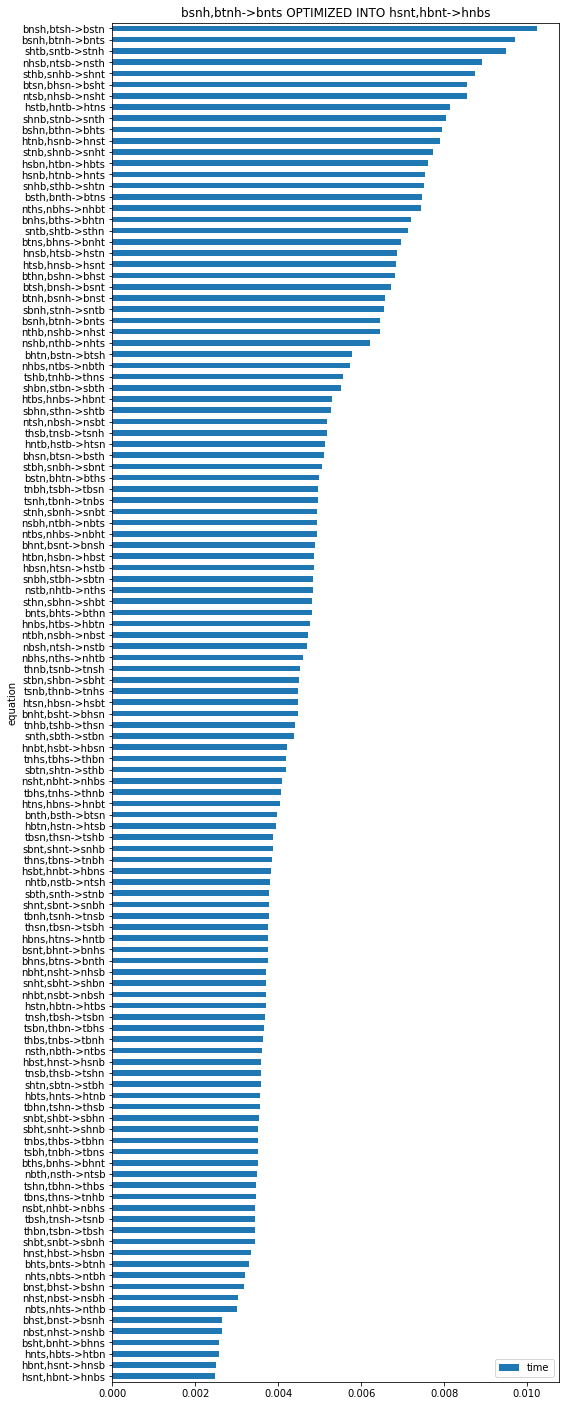
The optimized looked into all permutations. We see that the letter ordering should be carefully chosen.
import pandas
df = pandas.DataFrame(obj.timed_permutations_, columns=["time", "equation"])
df = df.sort_values('time')
df = df.set_index("equation")
ax = df.plot.barh(figsize=(8, 25))
ax.set_title("%s OPTIMIZED INTO %s" % (obj.equation, obj.equation_));