Benchmark#
Links: notebook, html, PDF, python, slides, GitHub
Ce notebook compare différents modèles depuis un notebook.
from jyquickhelper import add_notebook_menu
add_notebook_menu()
Si le message Widget Javascript not detected. It may not be installed
or enabled properly. apparaît, vous devriez exécuter la commande
jupyter nbextension enable --py --sys-prefix widgetsnbextension
depuis la ligne de commande. Le code suivant vous permet de vérifier que
cela a été fait.
from tqdm import tnrange, tqdm_notebook
from time import sleep

for i in tnrange(3, desc='1st loop'):
    for j in tqdm_notebook(range(20), desc='2nd loop'):
        sleep(0.01)
%matplotlib inline
Petit bench sur le clustering#
Définition du bench#
import dill
from tqdm import tnrange
from sklearn.cluster import AgglomerativeClustering, KMeans
from sklearn.datasets import make_blobs
from mlstatpy.ml import MlGridBenchMark

params = [dict(model=lambda : KMeans(n_clusters=3), name="KMeans-3", shortname="km-3"),
          dict(model=lambda : AgglomerativeClustering(), name="AgglomerativeClustering", shortname="aggclus")]

datasets = [dict(X=make_blobs(100, centers=3)[0], Nclus=3,
                 name="blob-100-3", shortname="b-100-3", no_split=True),
            dict(X=make_blobs(100, centers=5)[0], Nclus=5,
                 name="blob-100-5", shortname="b-100-5", no_split=True) ]

bench = MlGridBenchMark("TestName", datasets, fLOG=None, clog=None,
                        cache_file="cache.pickle", pickle_module=dill,
                        repetition=3, progressbar=tnrange,
                        graphx=["_time", "time_train", "Nclus"],
                        graphy=["silhouette", "Nrows"])
Lancer le bench#
bench.run(params)
0/|/2017-03-19 20:11:11 [BenchMark.run] number of cached run: 4: 0%|| 0/4 [00:00<?, ?it/s]
3/|/2017-03-19 20:11:13 [BenchMark.run] done.: 75%|| 3/4 [00:02<00:00, 1.10it/s] 11it/s]_train': 0.02142968022685221, 'time_test': 0.0025012412126208527, '_btry': 'aggclus-b-100-5', '_iexp': 2, 'model_name': 'AgglomerativeClustering', 'ds_name': 'blob-100-5', 'Nrows': 100, 'Nfeat': 2, 'Nclus': 5, 'no_split': True, '_date': datetime.datetime(2017, 3, 19, 20, 11, 11, 647355), '_time': 0.1007650830318858, '_span': datetime.timedelta(0, 0, 112581), '_i': 3, '_name': 'TestName'}: 75%|| 3/4 [00:00<00:00, 4.22it/s]]0:00, 3.53it/s]]
Récupérer les résultats#
df = bench.to_df()
df
| _btry | _date | _i | _iexp | _name | _span | _time | Nclus | Nfeat | Nrows | ds_name | model_name | no_split | own_score | silhouette | time_preproc | time_test | time_train | |
|---|---|---|---|---|---|---|---|---|---|---|---|---|---|---|---|---|---|---|
| 0 | km-3-b-100-3 | 2017-03-19 20:11:11.132135 | 0 | 0 | TestName | 0:00:00.147610 | 0.147594 | 3 | 2 | 100 | blob-100-3 | KMeans-3 | True | -175.396944 | 0.700618 | 0.009154 | 0.003195 | 0.044693 |
| 1 | km-3-b-100-3 | 0:00:00.147610 | 0 | 1 | TestName | 2017-03-19 20:11:11.140141 | 0.147594 | 3 | 2 | 100 | blob-100-3 | KMeans-3 | True | -175.396944 | 0.700618 | 0.006068 | 0.002803 | 0.037633 |
| 2 | km-3-b-100-3 | 2017-03-19 20:11:11.140141 | 0 | 2 | TestName | 0:00:00.155620 | 0.147594 | 3 | 2 | 100 | blob-100-3 | KMeans-3 | True | -175.396944 | 0.700618 | 0.006230 | 0.002630 | 0.035106 |
| 3 | aggclus-b-100-3 | 2017-03-19 20:11:11.317283 | 1 | 0 | TestName | 0:00:00.096081 | 0.096700 | 3 | 2 | 100 | blob-100-3 | AgglomerativeClustering | True | NaN | 0.662345 | 0.008147 | 0.002508 | 0.026997 |
| 4 | aggclus-b-100-3 | 0:00:00.096081 | 1 | 1 | TestName | 2017-03-19 20:11:11.325288 | 0.096700 | 3 | 2 | 100 | blob-100-3 | AgglomerativeClustering | True | NaN | 0.662345 | 0.009511 | 0.004156 | 0.016807 |
| 5 | aggclus-b-100-3 | 2017-03-19 20:11:11.325288 | 1 | 2 | TestName | 0:00:00.106088 | 0.096700 | 3 | 2 | 100 | blob-100-3 | AgglomerativeClustering | True | NaN | 0.662345 | 0.007018 | 0.003252 | 0.018227 |
| 6 | km-3-b-100-5 | 2017-03-19 20:11:11.452688 | 2 | 0 | TestName | 0:00:00.145130 | 0.145012 | 5 | 2 | 100 | blob-100-5 | KMeans-3 | True | -466.829200 | 0.790511 | 0.007587 | 0.002748 | 0.033610 |
| 7 | km-3-b-100-5 | 0:00:00.145130 | 2 | 1 | TestName | 2017-03-19 20:11:11.463199 | 0.145012 | 5 | 2 | 100 | blob-100-5 | KMeans-3 | True | -466.829200 | 0.790511 | 0.007471 | 0.002278 | 0.036098 |
| 8 | km-3-b-100-5 | 2017-03-19 20:11:11.463199 | 2 | 2 | TestName | 0:00:00.153136 | 0.145012 | 5 | 2 | 100 | blob-100-5 | KMeans-3 | True | -466.829200 | 0.790511 | 0.011576 | 0.004463 | 0.039103 |
| 9 | aggclus-b-100-5 | 2017-03-19 20:11:11.640351 | 3 | 0 | TestName | 0:00:00.101573 | 0.100765 | 5 | 2 | 100 | blob-100-5 | AgglomerativeClustering | True | NaN | 0.636241 | 0.009483 | 0.002418 | 0.020562 |
| 10 | aggclus-b-100-5 | 0:00:00.101573 | 3 | 1 | TestName | 2017-03-19 20:11:11.647355 | 0.100765 | 5 | 2 | 100 | blob-100-5 | AgglomerativeClustering | True | NaN | 0.636241 | 0.011532 | 0.001634 | 0.021456 |
| 11 | aggclus-b-100-5 | 2017-03-19 20:11:11.647355 | 3 | 2 | TestName | 0:00:00.112581 | 0.100765 | 5 | 2 | 100 | blob-100-5 | AgglomerativeClustering | True | NaN | 0.636241 | 0.009643 | 0.002501 | 0.021430 |
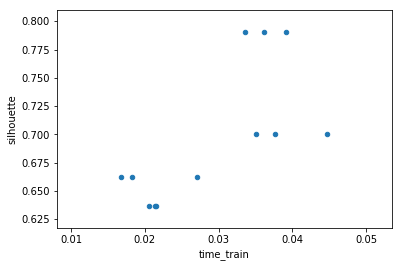
df.plot(x="time_train", y="silhouette", kind="scatter")
<matplotlib.axes._subplots.AxesSubplot at 0x122b8004748>
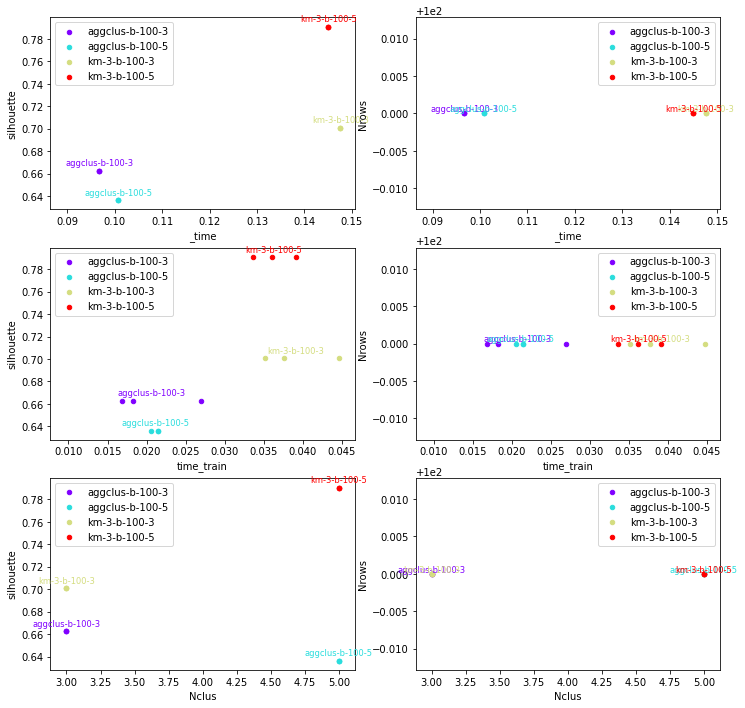
Dessin, Graphs#
bench.plot_graphs(figsize=(12,12))
array([[<matplotlib.axes._subplots.AxesSubplot object at 0x00000122B8269A90>,
        <matplotlib.axes._subplots.AxesSubplot object at 0x00000122B82E1DA0>],
       [<matplotlib.axes._subplots.AxesSubplot object at 0x00000122B83512E8>,
        <matplotlib.axes._subplots.AxesSubplot object at 0x00000122B83A1828>],
       [<matplotlib.axes._subplots.AxesSubplot object at 0x00000122B8409D68>,
        <matplotlib.axes._subplots.AxesSubplot object at 0x00000122B8462588>]], dtype=object)