Convert a tree into ONNX#
Links: notebook, html, PDF, python, slides, GitHub
This notebook shows how to create a tree and execute it with onnx and onnxruntime. The direct way to do it is simple to use ONNX API and more precisely, the node TreeEnsembleRegressor. Another option is to create a tree in scikit-learn and then to convert it using skl2onnx.
from jyquickhelper import add_notebook_menu
add_notebook_menu()
%load_ext mlprodict
Tree and cython#
Class DecisionTreeRegressor is the public API for a tree in scikit-learn. It relies one another implemented in cython called Tree. This one is private and not supposed to be accessed by users. All methods cannot be accessed from python including the one used to add nodes add_node. Then a little bit of cython is needed to actually create a tree… or we could use function tree_add_node.
from mlinsights.mltree._tree_digitize import tree_add_node
help(tree_add_node)
Help on built-in function tree_add_node in module mlinsights.mltree._tree_digitize:
tree_add_node(...)
    tree_add_node(tree, parent, is_left, is_leaf, feature, threshold, impurity, n_node_samples, weighted_n_node_samples)
    Adds a node to tree.
    :param parent: parent index (-1 for the root)
    :param is_left: is left node?
    :param is_leaf: is leave?
    :param feature: feature index
    :param threshold: threshold (or value)
    :param impurity: impurity
    :param n_node_samples: number of samples this node represents
    :param weighted_n_node_samples: node weight
A simple problem#
import numpy
import matplotlib.pyplot as plt
def plot_function(fct, title):
x_min, x_max = -1, 1
y_min, y_max = -1, 1
h = 0.02 # step size in the mesh
xx, yy = numpy.meshgrid(numpy.arange(x_min, x_max, h),
numpy.arange(y_min, y_max, h))
Z = fct(numpy.c_[xx.ravel(), yy.ravel()])
# Put the result into a color plot
Z = Z.reshape(xx.shape)
fig, ax = plt.subplots(1, 1, figsize=(4, 3))
ax.pcolormesh(xx, yy, Z)
ax.set_title(title)
return ax
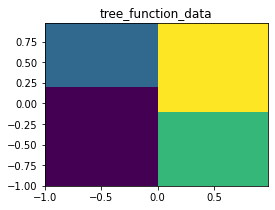
def tree_function(x, y):
if x <= 0:
if y <= 0.2:
return 0
else:
return 1
else:
if y <= -0.1:
return 2
else:
return 3
def tree_function_data(xy):
res = numpy.empty(xy.shape[0], dtype=numpy.float64)
for i in range(0, xy.shape[0]):
res[i] = tree_function(xy[i, 0], xy[i, 1])
return res
plot_function(tree_function_data, "tree_function_data");
<ipython-input-4-09db879347c8>:16: MatplotlibDeprecationWarning: shading='flat' when X and Y have the same dimensions as C is deprecated since 3.3.  Either specify the corners of the quadrilaterals with X and Y, or pass shading='auto', 'nearest' or 'gouraud', or set rcParams['pcolor.shading'].  This will become an error two minor releases later.
  ax.pcolormesh(xx, yy, Z)
The tree construction#
The tree needs two features and has three nodes.
from sklearn.tree._tree import Tree

UNUSED = 99999

values = []  # stored the predicted values

tree = Tree(2,  # n_features
            numpy.array([1], dtype=numpy.intp),  #  n_classes
            1,  # n_outputs
            )


# First node: the root: x <= 0
index = tree_add_node(tree,
                      -1,          # parent index
                      False,       # is left node
                      False,       # is leaf
                      0,           # feature index
                      0,           # threshold
                      0, 1, 1.)    # impurity, n_node_samples, node weight
values.append(UNUSED)


# Second node: y <= 0.2
index1 = tree_add_node(tree,
                       index,       # parent index
                       True,        # is left node
                       False,       # is leaf
                       1,           # feature index
                       0.2,         # threshold
                       0, 1, 1.)    # impurity, n_node_samples, node weight
values.append(UNUSED)

# First leaf
leaf_1 = tree_add_node(tree,
                       index1,      # parent index
                       True,        # is left node
                       True,        # is leaf
                       0,           # feature index
                       0,           # threshold
                       0, 1, 1.)    # impurity, n_node_samples, node weight
values.append(0)

# Second leaf
leaf_2 = tree_add_node(tree, index1, False, True, 0, 0, 0, 1, 1.)
values.append(1)

# Third node: y <= -0.1
index2 = tree_add_node(tree,
                       index,       # parent index
                       False,       # is left node
                       False,       # is right node
                       1,           # feature index
                       -0.1,        # threshold
                       0, 1, 1.)    # impurity, n_node_samples, node weight
values.append(UNUSED)

# Third leaf
leaf_3 = tree_add_node(tree,
                       index2,      # parent index
                       True,        # is left node
                       True,        # is leaf
                       0,           # feature index
                       0,           # threshold
                       0, 1, 1.)    # impurity, n_node_samples, node weight
values.append(2)

# Fourth leaf
leaf_4 = tree_add_node(tree, index2, False, True, 0, 0, 0, 1, 1.)
values.append(3)


index, index1, index2, values
(0, 1, 4, [99999, 99999, 0, 1, 99999, 2, 3])
The final detail.
tree.max_depth = 2
The internal structure is created, let’s complete the public API.
from sklearn.tree import DecisionTreeRegressor

reg = DecisionTreeRegressor()
reg.tree_ = tree
reg.tree_.value[:, 0, 0] = numpy.array(  # pylint: disable=E1137
    values, dtype=numpy.float64)
reg.n_outputs = 1
reg.n_outputs_ = 1
reg.n_features_in_ = 2  # scikit-learn >= 0.24
reg.maxdepth = tree.max_depth

reg
DecisionTreeRegressor()
plot_function(reg.predict, "DecisionTreeRegressor");
<ipython-input-4-09db879347c8>:16: MatplotlibDeprecationWarning: shading='flat' when X and Y have the same dimensions as C is deprecated since 3.3.  Either specify the corners of the quadrilaterals with X and Y, or pass shading='auto', 'nearest' or 'gouraud', or set rcParams['pcolor.shading'].  This will become an error two minor releases later.
  ax.pcolormesh(xx, yy, Z)
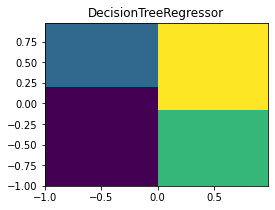
It is the same.
Conversion to ONNX#
The only difference is ONNX does not support double (float64) in opset 15 or below with TreeEnsembleRegressor. It does not really matter for this example but it could (see this example Discrepancies).
from skl2onnx import to_onnx

feat = numpy.empty((1, 2), dtype=numpy.float32)
onx = to_onnx(reg, feat, target_opset={'': 14, 'ai.onnx.ml': 2})

%onnxview onx
And we execute it with onnxruntime.
from onnxruntime import InferenceSession

sess = InferenceSession(onx.SerializeToString())

plot_function(lambda x: sess.run(None, {'X': x.astype(numpy.float32)})[0], "onnxruntime");
No CUDA runtime is found, using CUDA_HOME='C:Program FilesNVIDIA GPU Computing ToolkitCUDAv11.4'
<ipython-input-4-09db879347c8>:16: MatplotlibDeprecationWarning: shading='flat' when X and Y have the same dimensions as C is deprecated since 3.3.  Either specify the corners of the quadrilaterals with X and Y, or pass shading='auto', 'nearest' or 'gouraud', or set rcParams['pcolor.shading'].  This will become an error two minor releases later.
  ax.pcolormesh(xx, yy, Z)
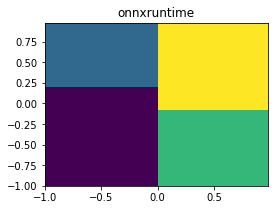
Still the same.
Text visualization#
This can be useful to debug a function building a tree.
See onnx_text_plot_tree, export_text, plot_tree.
from mlprodict.plotting.text_plot import onnx_text_plot_tree

print(onnx_text_plot_tree(onx.graph.node[0]))
n_targets=1
n_trees=1
----
treeid=0
 X0 <= 0.0
   F X1 <= -0.1
      F y=3.0 f=0 i=6
      T y=2.0 f=0 i=5
   T X1 <= 0.19999999
      F y=1.0 f=0 i=3
      T y=0.0 f=0 i=2
from sklearn.tree import export_text

print(export_text(reg))
|--- feature_0 <= 0.00
|   |--- feature_1 <= 0.20
|   |   |--- value: [0.00]
|   |--- feature_1 >  0.20
|   |   |--- value: [1.00]
|--- feature_0 >  0.00
|   |--- feature_1 <= -0.10
|   |   |--- value: [2.00]
|   |--- feature_1 >  -0.10
|   |   |--- value: [3.00]
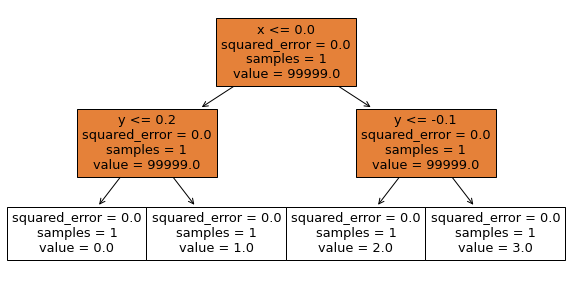
from sklearn.tree import plot_tree

fig = plt.figure(figsize=(10,5))
plot_tree(reg, feature_names=['x', 'y'], filled=True);
Convert a forest of trees#
sklearn-onnx does not support the conversion of mulitple trees in a list. It can only convert a model. Converting list produces the following error:
try:
    to_onnx([reg, reg], feat, target_opset={'': 14, 'ai.onnx.ml': 2})
except Exception as e:
    print(e)
Unable to find a shape calculator for type '<class 'list'>'.
It usually means the pipeline being converted contains a
transformer or a predictor with no corresponding converter
implemented in sklearn-onnx. If the converted is implemented
in another library, you need to register
the converted so that it can be used by sklearn-onnx (function
update_registered_converter). If the model is not yet covered
by sklearn-onnx, you may raise an issue to
onnx/sklearn-onnx#issues
to get the converter implemented or even contribute to the
project. If the model is a custom model, a new converter must
be implemented. Examples can be found in the gallery.
However, the model RandomForestRegressor is an average of decision trees which we can use to convert those trees. Let’s assume we want to convert weighted average of regressions tree. We first need to multiply every leaf of a tree by its weight.
from sklearn.tree._tree import Tree
from sklearn.tree import DecisionTreeRegressor
from sklearn.ensemble import RandomForestRegressor


def build_dummy_tree(leaf_values):
    UNUSED = 99999
    values = []

    tree = Tree(2,  # n_features
                numpy.array([1], dtype=numpy.intp),  #  n_classes
                1,  # n_outputs
                )


    # First node: the root: x <= 0
    index = tree_add_node(tree,
                          -1,          # parent index
                          False,       # is left node
                          False,       # is leaf
                          0,           # feature index
                          0,           # threshold
                          0, 1, 1.)    # impurity, n_node_samples, node weight
    values.append(UNUSED)


    # Second node: y <= 0.2
    index1 = tree_add_node(tree,
                           index,       # parent index
                           True,        # is left node
                           False,       # is leaf
                           1,           # feature index
                           0.2,         # threshold
                           0, 1, 1.)    # impurity, n_node_samples, node weight
    values.append(UNUSED)

    # First leaf
    leaf_1 = tree_add_node(tree, index1, True, True, 0, 0, 0, 1, 1.)
    values.append(leaf_values[0])

    # Second leaf
    leaf_2 = tree_add_node(tree, index1, False, True, 0, 0, 0, 1, 1.)
    values.append(leaf_values[1])

    # Third node: y <= -0.1
    index2 = tree_add_node(tree,
                           index,       # parent index
                           False,       # is left node
                           False,       # is right node
                           1,           # feature index
                           -0.1,        # threshold
                           0, 1, 1.)    # impurity, n_node_samples, node weight
    values.append(UNUSED)

    # Third leaf
    leaf_3 = tree_add_node(tree, index2, True, True, 0, 0, 0, 1, 1.)
    values.append(leaf_values[2])

    # Fourth leaf
    leaf_4 = tree_add_node(tree, index2, False, True, 0, 0, 0, 1, 1.)
    values.append(leaf_values[3])

    tree.value[:, 0, 0] = numpy.array(values, dtype=numpy.float64)

    reg = DecisionTreeRegressor()
    reg.tree_ = tree
    reg.n_outputs = 1
    reg.n_outputs_ = 1
    reg.n_features_in_ = 2  # scikit-learn >= 0.24
    reg.maxdepth = tree.max_depth
    return reg


def build_dummy_forest(trees):
    rf = RandomForestRegressor()
    rf.estimators_ = trees
    rf.n_outputs_ = trees[0].n_outputs_
    rf.n_features_in_ = trees[0].n_features_in_
    return rf


tree1 = build_dummy_tree(
    numpy.array([4, 5, -5, -6], dtype=numpy.float32) * 0.2)
tree2 = build_dummy_tree(
    numpy.array([5, 6, 5, -7], dtype=numpy.float32) * 0.8)

rf = build_dummy_forest([tree1, tree2])
print(export_text(rf.estimators_[0]))
print(export_text(rf.estimators_[1]))
|--- feature_0 <= 0.00
|   |--- feature_1 <= 0.20
|   |   |--- value: [0.80]
|   |--- feature_1 >  0.20
|   |   |--- value: [1.00]
|--- feature_0 >  0.00
|   |--- feature_1 <= -0.10
|   |   |--- value: [-1.00]
|   |--- feature_1 >  -0.10
|   |   |--- value: [-1.20]
|--- feature_0 <= 0.00
|   |--- feature_1 <= 0.20
|   |   |--- value: [4.00]
|   |--- feature_1 >  0.20
|   |   |--- value: [4.80]
|--- feature_0 >  0.00
|   |--- feature_1 <= -0.10
|   |   |--- value: [4.00]
|   |--- feature_1 >  -0.10
|   |   |--- value: [-5.60]
rf.predict(numpy.array([[0, 2.5]]))
array([2.9000001])
Conversion to ONNX.
feat = numpy.empty((1, 2), dtype=numpy.float32)
onx = to_onnx(rf, feat, target_opset={'': 14, 'ai.onnx.ml': 2})

%onnxview onx
sess = InferenceSession(onx.SerializeToString())

sess.run(None, {'X': numpy.array([[0, 2.5]], dtype=numpy.float32)})
[array([[2.9]], dtype=float32)]
It works.