module datasets.graph#
Short summary#
module papierstat.datasets.graph
Fonctions retournant des jeux de données liés aux graphes.
Functions#
function |
truncated documentation |
|---|---|
Graphe très petit. La fonction retourne une matrice dans laquelle chaque élément représente la probabilité de passer … |
Documentation#
Fonctions retournant des jeux de données liés aux graphes.
- papierstat.datasets.graph.create_tiny_graph()#
Graphe très petit. La fonction retourne une matrice dans laquelle chaque élément représente la probabilité de passer du noeud i au noeud j. Notebooks associés à ce jeu de données :
- Renvoie:
<<<
from papierstat.datasets import create_tiny_graph
print(create_tiny_graph())
>>>
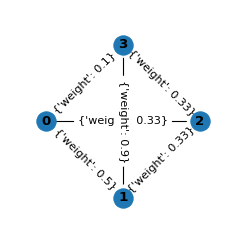
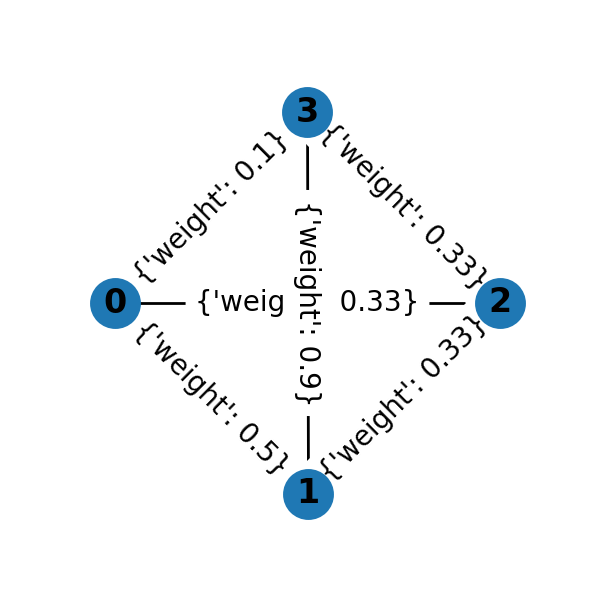
    /var/lib/jenkins/workspace/papierstat/papierstat_UT_39_std/_doc/sphinxdoc/source/papierstat/datasets/graph.py:59: PendingDeprecationWarning: the matrix subclass is not the recommended way to represent matrices or deal with linear algebra (see https://docs.scipy.org/doc/numpy/user/numpy-for-matlab-users.html). Please adjust your code to use regular ndarray.
      P = numpy.matrix([[0, 0.5, 0, 0.5], [0.5, 0, 0.5, 0],
    [[0.         0.5        0.         0.5       ]
     [0.5        0.         0.5        0.        ]
     [0.33333333 0.33333333 0.         0.33333333]
     [0.1        0.9        0.         0.        ]]
from papierstat.datasets import create_tiny_graph
P = create_tiny_graph()

import networkx as nx
G = nx.Graph()
for i in range(0, max(P.shape)):
    G.add_node(i)
for i in range(0, P.shape[0]):
    for j in range(0, P.shape[1]):
        if P[i,j] !=0 :
            G.add_edge(i,j, weight=int(P[i,j] * 100)/100)

import matplotlib.pyplot as plt
fig, ax = plt.subplots(1, 1, figsize=(3,3))
pos = nx.shell_layout(G)
nx.draw(G, with_labels=True, font_weight='bold', ax=ax, pos=pos)
nx.draw_networkx_edge_labels(G, pos=pos)
plt.show()
