example of a corrplot
Links: notebook, html, PDF, python, slides, GitHub
Biokit proposes nice graphs for correlation: corrplot function in Python but it only works with Python 2.7. I took the code out and put a modified version of in pyensae.
%matplotlib inline
import pyensae
import matplotlib.pyplot as plt
plt.style.use('ggplot')
import pandas
import numpy
letters = "ABCDEFGHIJKLM"[0:10]
df = pandas.DataFrame(dict(( (k, numpy.random.random(10)+ord(k)-65) for k in letters)))
df.head()
| A | B | C | D | E | F | G | H | I | J | |
|---|---|---|---|---|---|---|---|---|---|---|
| 0 | 0.887637 | 1.486102 | 2.415496 | 3.781093 | 4.493253 | 5.084982 | 6.484193 | 7.650366 | 8.774344 | 9.898334 |
| 1 | 0.104720 | 1.779278 | 2.466874 | 3.189288 | 4.148460 | 5.127938 | 6.668241 | 7.770889 | 8.394404 | 9.206735 |
| 2 | 0.735222 | 1.593792 | 2.734176 | 3.739522 | 4.554242 | 5.513305 | 6.451066 | 7.477368 | 8.063440 | 9.937340 |
| 3 | 0.505974 | 1.119941 | 2.033909 | 3.945594 | 4.514602 | 5.271045 | 6.764156 | 7.095581 | 8.254990 | 9.599061 |
| 4 | 0.563323 | 1.001843 | 2.603700 | 3.199254 | 4.968366 | 5.720844 | 6.015494 | 7.629919 | 8.932106 | 9.229564 |
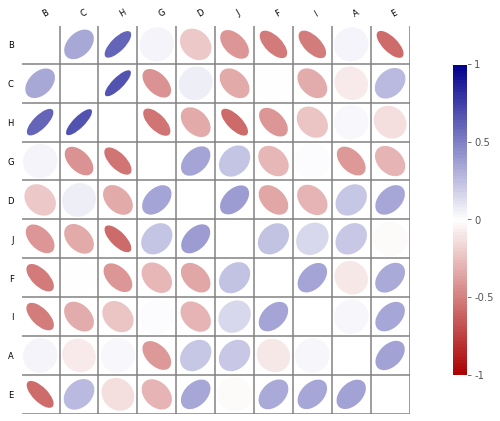
from pyensae.graphhelper import Corrplot
c = Corrplot(df)
c.plot(figsize=(12,6))
Computing correlation
<matplotlib.axes._subplots.AxesSubplot at 0x2149824cac8>
To avoid created another graph container:
fig = plt.figure(num=None, facecolor='white', figsize=(12,6))
ax = plt.subplot(1, 1, 1, aspect='equal', facecolor='white')
c = Corrplot(df)
c.plot(ax=ax)
Computing correlation
<matplotlib.axes._subplots.AxesSubplot at 0x21498a307f0>

<matplotlib.figure.Figure at 0x21498847fd0>
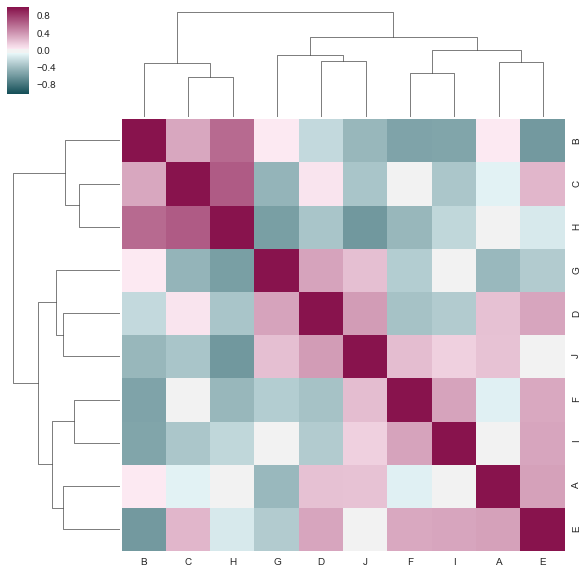
We compare it with seaborn and this example Discovering structure in heatmap data.
import seaborn as sns
cmap = sns.diverging_palette(h_neg=210, h_pos=350, s=90, l=30, as_cmap=True, center="light")
sns.clustermap(df.corr(), figsize=(10, 10), cmap=cmap)
c:python35_x64libsite-packagesmatplotlibcbook.py:137: MatplotlibDeprecationWarning: The axisbg attribute was deprecated in version 2.0. Use facecolor instead.
  warnings.warn(message, mplDeprecation, stacklevel=1)
<seaborn.matrix.ClusterGrid at 0x2149a0db160>