Note
Go to the end to download the full example code
Tries a random strategy and show the results
The following examples runs the game 2048 and keeps the highest number obtained for every try and two strategies.
import numpy
import matplotlib.pyplot as plt

from pystrat2048.random_strategy import (
    random_strategy, random_strategy_all_but_one
)
from pystrat2048 import evaluate_strategy, Game2048
The first strategy random_strategy
draws a random direction.
[16, 32, 32, 32, 32, 32, 32, 32, 32, 32, 32, 32, 32, 32, 32, 32, 32, 32, 32, 64, 64, 64, 64, 64, 64, 64, 64, 64, 64, 64, 64, 64, 64, 64, 64, 64, 64, 64, 64, 64, 128, 128, 128, 128, 128, 128, 128, 128, 128, 128]
The second strategy random_strategy_all_but_one
draws a random direction among four except one.
[16, 16, 16, 16, 32, 32, 32, 32, 32, 32, 32, 32, 32, 32, 32, 32, 32, 32, 32, 32, 32, 32, 32, 32, 32, 64, 64, 64, 64, 64, 64, 64, 64, 64, 64, 64, 64, 64, 64, 64, 128, 128, 128, 128, 128, 128, 128, 128, 128, 128]
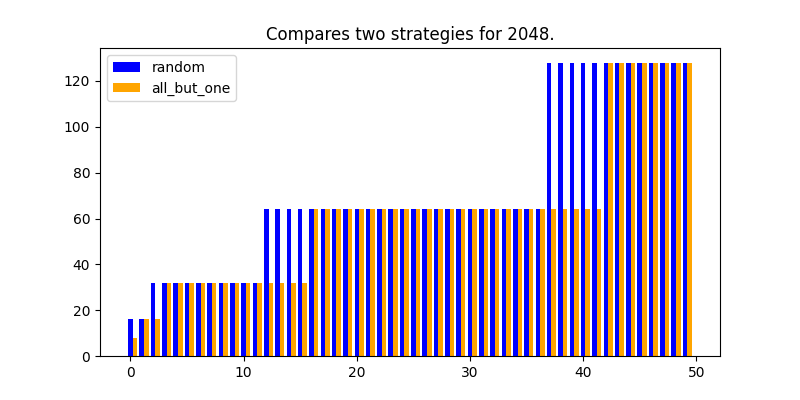
Finaly plots the gains obtained by the two strategies.
fig, ax = plt.subplots(1, 1, figsize=(8, 4))
ax.bar(numpy.arange(len(res1)), res1, color="b",
       label="random", width=0.4)
ax.bar(numpy.arange(len(res2)) + 0.4, res2, color="orange",
       label="all_but_one", width=0.4)
ax.set_title("Compares two strategies for 2048.")
ax.legend()
<matplotlib.legend.Legend object at 0x7fa062ce3280>
Now a custom strategy. This one tries every direction and chooses the direction which keeps the most empty cells.
def look_into_every_direction_choose_best(game, state, moves):
    """
    The strategy tries every direction and chooses the direction
    which keeps the most empty cells.
    """
    best = None
    bestd = None
    for d in range(0, 4):
        g = Game2048(game.copy())
        g.play(d)
        empty = numpy.sum(g.game.ravel() == 0)
        if best is None or empty > best:
            best = empty
            bestd = d
    return bestd
Let’s play 50 games.
[32, 32, 64, 64, 64, 64, 64, 64, 64, 64, 64, 64, 64, 64, 64, 64, 64, 128, 128, 128, 128, 128, 128, 128, 128, 128, 128, 128, 128, 128, 128, 128, 128, 128, 128, 128, 128, 128, 128, 128, 128, 128, 256, 256, 256, 256, 256, 256, 256, 256]
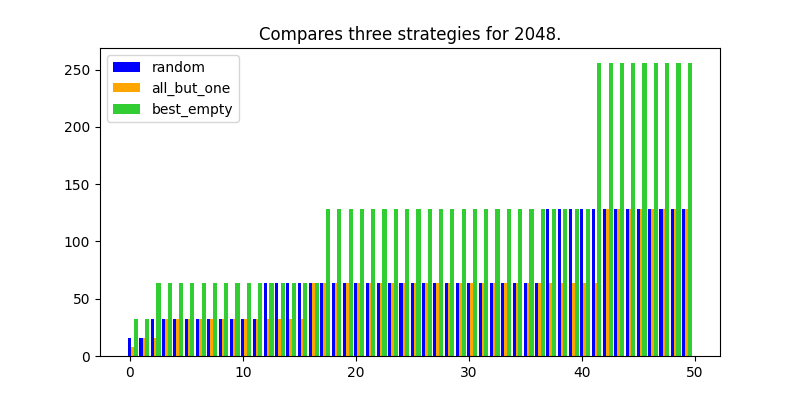
Finaly plots the gains obtained by the three strategies.
fig, ax = plt.subplots(1, 1, figsize=(8, 4))
ax.bar(numpy.arange(len(res1)), res1, color="b",
       label="random", width=0.27)
ax.bar(numpy.arange(len(res2)) + 0.27, res2, color="orange",
       label="all_but_one", width=0.27)
ax.bar(numpy.arange(len(res3)) + 0.54, res3, color="limegreen",
       label="best_empty", width=0.37)
ax.set_title("Compares three strategies for 2048.")
ax.legend()
<matplotlib.legend.Legend object at 0x7fa062af7a30>
One seems better but 50 tries does not seem to be enough to be fully sure.
plt.show()
Total running time of the script: (0 minutes 23.984 seconds)