2013-09-26 Busy areas in Paris
During summer, one pleasure is to go to work by bike. Simple option is to take a Velib but most of the time, the closest Velib station is empty. The same thing happens when you leave your work to go back home. No bike is available.
I thought maybe this could be used to draw a map of Paris showing areas where people work. I thought about looking at the distribution of the number of available bikes over a day. I already mentioned that the Velib data was available (see Les stations Vélib à Paris un jeudi soir). Next figure shows it for a couple of stations and one of them is clearly a working station: bikes arrive in the morning and disappear at the end of the working day (it was taken a couple of weeks ago during a week day).
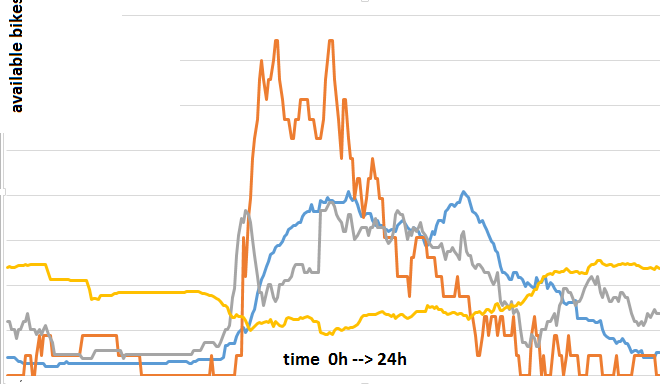
The number of available bikes was measured every five minutes. Knowing that every station does not have the same number of spots, I normalized the previous curve by the sum. I then considered the sum between 10am and 4pm. So for each station, I built the following indicator:
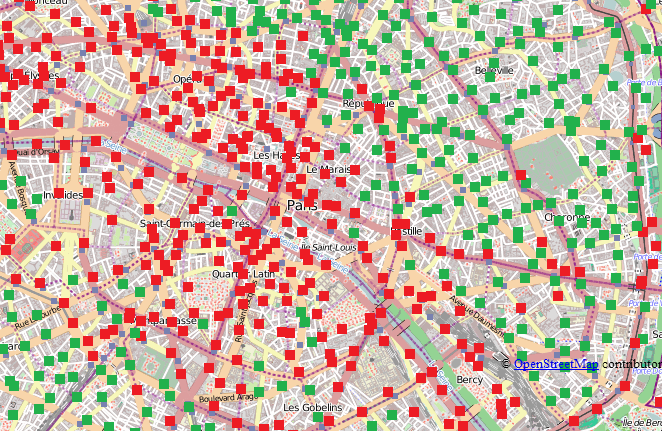
Basically, companies offices are located in the center of Paris (districts with one digit) and around the Seine, people live around (districts with two digits). It also shows there are some business areas just outside Paris like Issy-Les-Moulineaux (where I work). You can play with the final result below. It uses OpenStreetMap and OpenLayers.
A sketch of the code follows. It was done to illustrate my teachings. I used Python to generate the javascript. The code can be found here. It could be easily modified to add some text on the map such as the values taken by the indicator.
  <div id="mapdiv"></div>
  <script src="http://www.openlayers.org/api/OpenLayers.js"></script>
  <script>
    map = new OpenLayers.Map("mapdiv");
    map.addLayer(new OpenLayers.Layer.OSM());
    var proj =  new OpenLayers.Projection("EPSG:4326");

    var size = new OpenLayers.Size(10,10);
    var offset = new OpenLayers.Pixel(-(size.w/2), -size.h);

    var icon_rouge = new OpenLayers.Icon('http://www.xavierdupre.fr/blog/documents/carrerouge.png', size, offset);
    var icon_vert = new OpenLayers.Icon('http://www.xavierdupre.fr/blog/documents/carrevert.png', size, offset);

    var zoom=13;

    var markers = new OpenLayers.Layer.Markers( "Markers" );
    map.addLayer(markers);

    var lonLat0 = new OpenLayers.LonLat( 2.374340555 ,48.83713369 ).transform(proj, map.getProjectionObject() );
    markers.addMarker(new OpenLayers.Marker(position=lonLat0,icon=icon_rouge.clone()));

    var lonLat1 = new OpenLayers.LonLat( 2.301961227 ,48.85213621 ).transform(proj, map.getProjectionObject() );
    markers.addMarker(new OpenLayers.Marker(position=lonLat1,icon=icon_rouge.clone()));

    ...
  </script>
2013/11/26: you can find similar information on the following page - Shogun - A Large Scale Machine Learning Toolbox.
2014/05/05: before doing anything with OpenStreetMap, you should check the library leafletjs. Pretty nice.
| <-- --> |
Xavier Dupré
|