2013-02-12 Graph using Javascript and D3.js
I don't remember how I found this library D3.js, probably while looking for something than Graphviz because I was not able to easily connect to draw a graph on a webpage. I discovered two days ago than a Python library (PIL) I used to recommend to my student was not maintained any more and had been replaced by another one (Pillow). To draw graph, I usually recommend Matplotlib but I was wondering why not trying another one and another language which allows animated graphs. So here are my first steps with D3.js which I intent to use to draw a very simple plot.
Before writing the script
The first step starts by create a spot on the webpage:
<div id="graphid"></div>It also requires data which I stored in a separate file marathon.txt:
city	year	time	seconds
PARIS	2011	02:06:29	7589
PARIS	2010	02:06:41	7601
PARIS	2009	02:05:47	7547
PARIS	2008	02:06:40	7600
PARIS	2007	02:07:17	7637
PARIS	2006	02:08:03	7683
...
I like the fact, every time I press F5, the browser opens up and show me my page. I use SciTE as a text editor. Simple but debugging is quite difficult. For that, I used Chrome to the error (look at option activate the debug console). Anyway, let's begin. It first requires to inclure the library:
<script src="http://d3js.org/d3.v3.js"></script>It can be placed in the header or in the body. You should then configure the style otherwise your graph may not have the look you are looking for:
<style>
.axis path,
.axis line {
  fill: none;
  stroke: #000;
  shape-rendering: crispEdges;
}

.x.axis path {
  display: none;
}

.line {
  fill: none;
  stroke: steelblue;
  stroke-width: 1.5px;
}
</style>
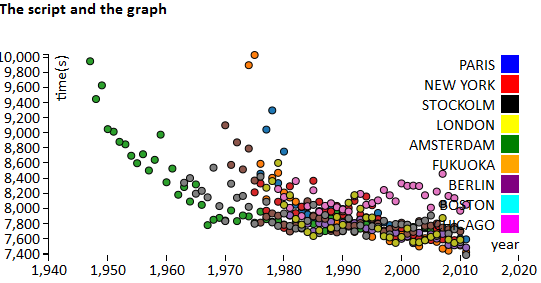
The script and the graph
// graph size
var margin = {top: 20, right: 80, bottom: 30, left: 50} ;
var width = 600 - margin.left - margin.right ;
var height = 250 - margin.top - margin.bottom;
var color = d3.scale.category10();

// we define the axis
var x = d3.scale.linear().range([0, width]);
var y = d3.scale.linear().range([height, 0]);

var xAxis = d3.svg.axis().scale(x).orient("bottom");
var yAxis = d3.svg.axis().scale(y).orient("left");

// we choose the graph position (don't forget #)
var svg = d3.select("#graphid").append("svg")
    .attr("width", width + margin.left + margin.right)
    .attr("height", height + margin.top + margin.bottom)
  .append("g")
    .attr("transform", "translate(" + margin.left + "," + margin.top + ")");

d3.tsv("documents/marathon.tsv", function(error, data) {

    // one color per city
    var colors = { "PARIS":"blue", "NEW YORK":"red", "STOCKOLM":"black",
                    "LONDON":"yellow", "AMSTERDAM":"green",
                    "FUKUOKA":"orange", "BERLIN":"purple", "BOSTON":"cyan", "CHICAGO":"magenta" } ;

  // we define the real columns
  // if data is undefined, use the debugger to watch error
  // which contains the reason why it does not properly load
  data.forEach(function(d) {
    d.year = +d.year;
    d.seconds = +d.seconds;
    d.color = colors[d.city] ;
    d.city = d.city ;
  });

  // we define the axis limits
  x.domain(d3.extent(data, function(d) { return d.year; })).nice();
  y.domain([d3.min(data, function(d) { return d.seconds; }),
             d3.max(data, function(d) { return d.seconds; })]);

  // we define the axis
  svg.append("g")
      .attr("class", "x axis")
      .attr("transform", "translate(0," + height + ")")
      .call(xAxis)
    .append("text")
      .attr("class", "label")
      .attr("x", width)
      .attr("y", -6)
      .style("text-anchor", "end")
      .text("year");

  svg.append("g")
      .attr("class", "y axis")
      .call(yAxis)
    .append("text")
      .attr("class", "label")
      .attr("transform", "rotate(-90)")
      .attr("y", 6)
      .attr("dy", ".71em")
      .style("text-anchor", "end")
      .text("time(s)")

  // we define the data
  svg.selectAll(".dot")
      .data(data)
    .enter().append("circle")
      .attr("class", "dot")
      .attr("r", 3.5)
      .attr("cx", function(d) { return x(d.year); })
      .attr("cy", function(d) { return y(d.seconds); })
      .style("fill", function(d) { return color(d.color); });

  // the legend
    var keys = []
    for(var key in colors) { keys.push( key );     }

    var legend = svg.selectAll(".legend")
      .data(keys.slice())
    .enter().append("g")
      .attr("class", "legend")
      .attr("transform", function(d, i) { return "translate(0," + i * 20 + ")"; });

    legend.append("rect")
      .attr("x", width - 18)
      .attr("width", 18)
      .attr("height", 18)
      .style("fill", function(d) { return colors[d]; } );

    legend.append("text")
      .attr("x", width - 24)
      .attr("y", 9)
      .attr("dy", ".35em")
      .style("text-anchor", "end")
      .text(function(d) { return d } );

});
Conclusion
Well, it is a nice tool but I give up here. It took me longer than I thought to get than done and I did not try any animation. I hope I won't forget next time or maybe I should write a kind of wrapper to produce the graphs I usually use. The tutorial here seems quite good Dashing D3js. You can find some beautiful graphs here: Mike Bostock.
|
Xavier Dupré
|