2015-05-05 c3.js
c3.js is a framework based on d3.js. Simple graphs can be obtained with shorter scripts compared to d3.js. If you are curious, you can look for b3.js, a3.js (for 3D graphs). Then you an go on with d4.js...
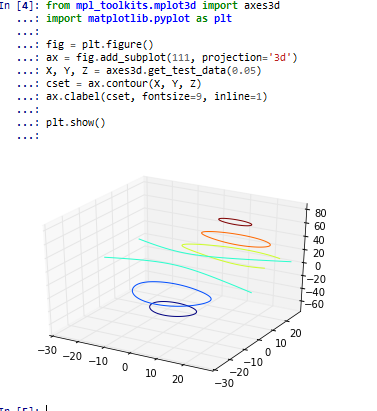
2014-08-24 Graphiques avec Python, R
R reste la référence en matière de statistiques mais pour tout un tas de raisons, je choisis Python dès que je peux. Je travaille beaucoup avec les notebooks que je trouve très agréables, plutôt robustes et simples à partager. Je me suis penché sur les graphiques en Python, matplotlib, des cartes et des graphiques interactifs qui s'intègrent particulièrement bien avec les notebooks : visualisation des données. Et si Python ne suffit pas, il est facile de revenir à R dans les notebooks avec rmagic que je trouve plus faciles à utiliser que shiny ou knitr - les notebooks sous R. Voici un notebook mêlant R et Python : Rmagic Functions Extension.
2013-11-30 More about interactive graphs using Python, d3.js, R, shiny, IPython, vincent, d3py, python-nvd3
I recently found this url The Big List of D3.js Examples. As d3.js is getting popular - their website is pretty nice -, I was curious if I could easily use it through Python. After a couple of searches (many in fact), I discovered vincent and some others. It ended up doing a quick review. Every script was tested with Python 3.
Contents:
- Graphs with IPython and QtConsole
- Graphs with IPython Notebook
- Graph with d3.js and IPython Notebook
- Graphs with Python and vincent
- Graphs with Python and d3py
- Graphs with IPython and nvd3
- R with shiny
- Alternatives
- How will you share the graph? (no share, image, web + HTML and Javascript, web + R)
- Can you see the graph you want to do in galleries?
Use of IPython (qt)console
The QtConsole looks like a command line window but is able to display images inline using matplotlib:
more...
2013-09-29 Zoomer sur graphe XY avec d3.js
d3.js est un framework écrit en javascript qui permet de visualiser des données. Il est conçu pour des sites web et permet de créer des graphes animés. Le résultat est assez esthétique à en juger par les différentes galleries :
Tout d'abord, je dois dire que ça prend du temps de concevoir un graphe. Mon objectif était de créer un graphe XY et de pouvoir zoomer horizontalemen sur une partie. Quand on découvre l'outil et les spécifités de javascript, il est préférable de partir d'une exemple qui fonctionne déjà sans trop chercher à aggréger des bouts de codes venant de plusieurs graphes. L'exemple que j'ai trouvé pour le zoom vient d'ici : js fiddle. Appliqué à mes données, cela donne :
Les premiers pas sont tout de même assez longs, les erreurs ne sont pas faciles à comprendre, surtout quand on est novice. On espère que ce graphe qu'on est en train de constuire pourra resservir. Cela dit voici, quelques astuces.
more...
2013-02-12 Graph using Javascript and D3.js
I don't remember how I found this library D3.js, probably while looking for something than Graphviz because I was not able to easily connect to draw a graph on a webpage. I discovered two days ago than a Python library (PIL) I used to recommend to my student was not maintained any more and had been replaced by another one (Pillow). To draw graph, I usually recommend Matplotlib but I was wondering why not trying another one and another language which allows animated graphs. So here are my first steps with D3.js which I intent to use to draw a very simple plot.
Before writing the script
The first step starts by create a spot on the webpage:
<div id="graphid"></div>It also requires data which I stored in a separate file marathon.txt:
city	year	time	seconds
PARIS	2011	02:06:29	7589
PARIS	2010	02:06:41	7601
PARIS	2009	02:05:47	7547
PARIS	2008	02:06:40	7600
PARIS	2007	02:07:17	7637
PARIS	2006	02:08:03	7683
...
I like the fact, every time I press F5, the browser opens up and show me my page. I use SciTE as a text editor. Simple but debugging is quite difficult. For that, I used Chrome to the error (look at option activate the debug console). Anyway, let's begin. It first requires to inclure the library:
<script src="http://d3js.org/d3.v3.js"></script>It can be placed in the header or in the body. You should then configure the style otherwise your graph may not have the look you are looking for:
|
Xavier Dupré
|