Note
Go to the end to download the full example code
Représentation du R0 par départements
Cet exemple reprend des données de tests par gouvernement pour calculer le coefficient R0 de l’épidémie. La méthode de Cori est utilisée avec la formule proposée dans covidtracker :
Où \(C_i\) est le nombre de cas positifs du jour i. Cette méthode est implémentée dans le package R EpiEstim ou epyestim pour le langage python. Dans cet exemple, il sera calculé directement à partir des données.
Sources de données:
Récupération des données
import warnings
from pandas import Timedelta, DataFrame
from geopandas import GeoDataFrame
import matplotlib.pyplot as plt
from mpl_toolkits.axes_grid1 import make_axes_locatable
from aftercovid.data import (
    data_covid_france_departments_tests,
    data_france_departments)


def valid(df):
    "Checks that a dataframe is not empty."
    if 0 in df.shape:
        raise ValueError(
            f"One dataframe is empty with shape={df.shape!r}.")
    return df


case = data_covid_france_departments_tests(metropole=True)
case.tail()
somewhereaftercovid_39_std/aftercovid/aftercovid/data/pandas_cache.py:24: DtypeWarning: Columns (0) have mixed types. Specify dtype option on import or set low_memory=False.
  df = pandas.read_csv(url, **kwargs)  # pragma: no cover
Aggrégation par départements et par jour.
case = valid(
    case[case.cl_age90 != 0].groupby(['dep', 'jour'], as_index=False).sum()
)
case.tail()
Quelques aggrégations, par département.
deps = valid(case.groupby(["dep", "jour"], as_index=False).sum())
deps.tail(n=10)
Sur tout le territoire.
france = case.groupby(["jour"], as_index=False).sum()
france.tail(n=10)
Calcul du R
def compute_r(df, col_day='jour', col='P', last_day=None):
    if last_day is None:
        last_day = df.jour.max()
    v1 = last_day - Timedelta(days=6)
    v2 = last_day
    p1 = last_day - Timedelta(days=13)
    p2 = last_day - Timedelta(days=7)
    w1 = df[(df[col_day] >= p1) & (df[col_day] <= p2)]
    w2 = df[(df[col_day] >= v1) & (df[col_day] <= v2)]
    return w2[col].sum() / w1[col].sum()


compute_r(france)
0.7627323195751871
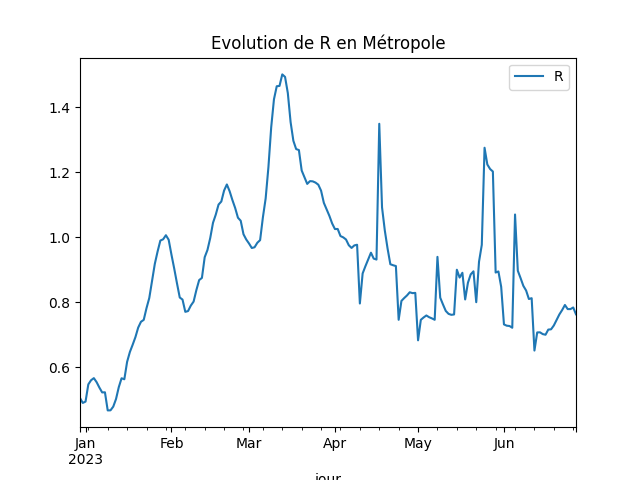
On regarde quelle tête ça a sur six mois. Ce n’est pas le code le plus efficace mais c’est rapide à écrire. Dans le cas idéal, il faudra s’assurer que toutes les dates sont présents et les compléter le cas échéants puis calculer l’estimateur sur des fenêtres glissantes.
Et on dessine.
gr.set_index('jour').plot(title="Evolution de R en Métropole")
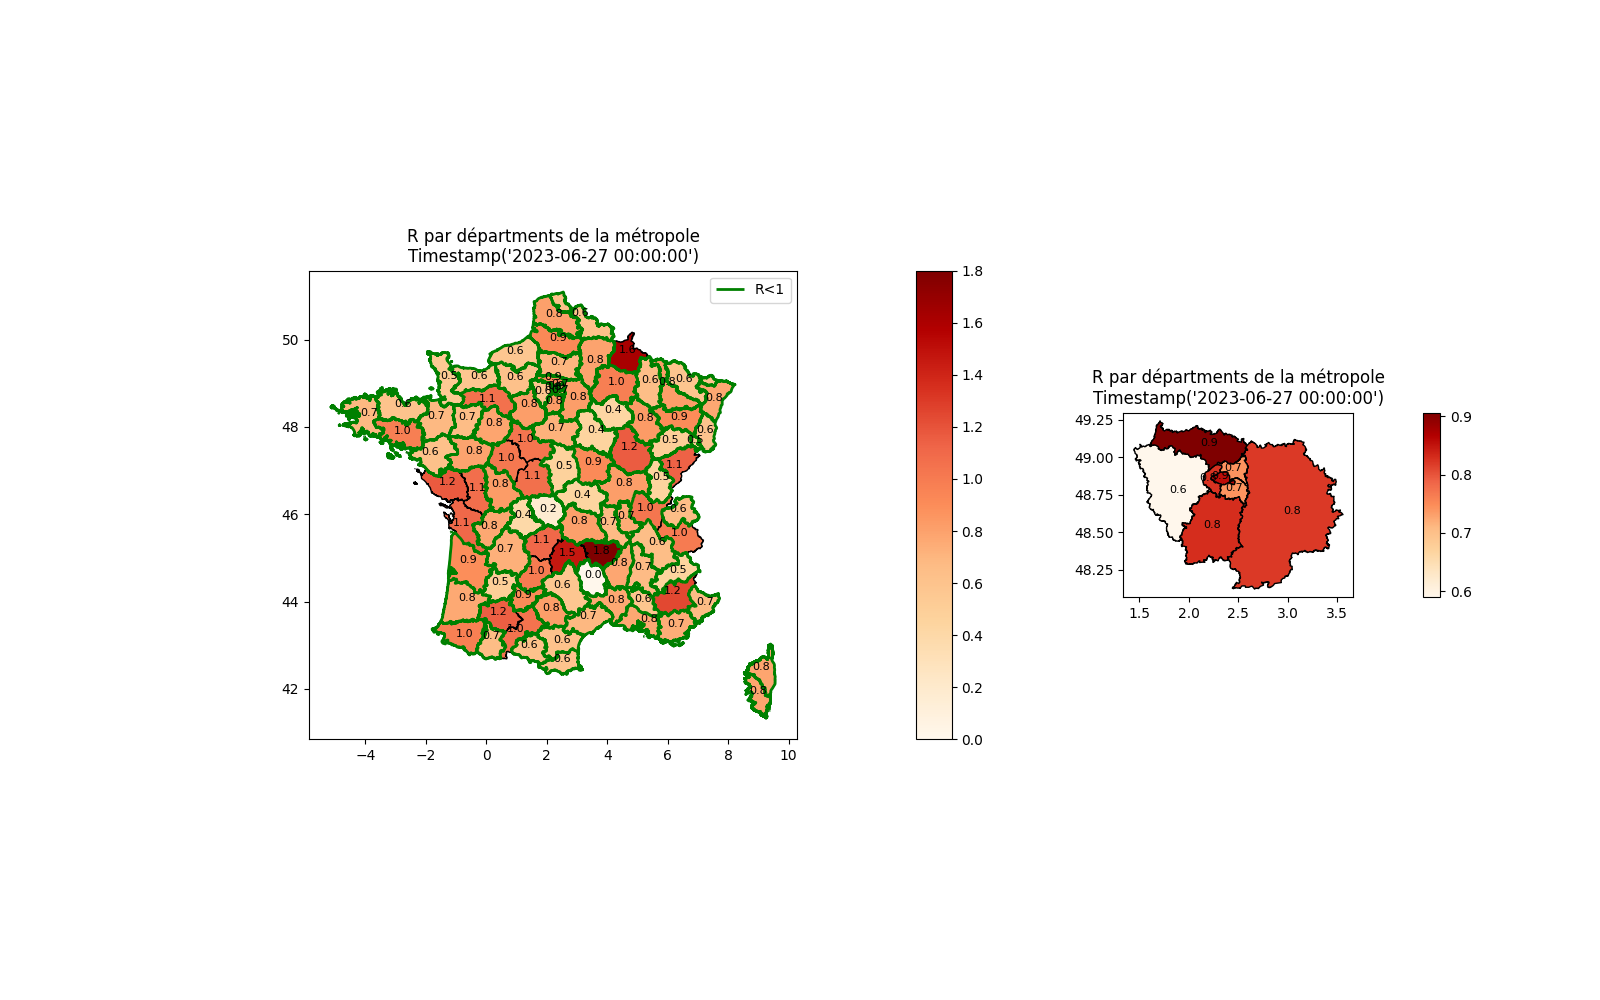
Carte du R par département
On calcule les R par départements.
On récupère les contours des départements français.
loc = data_france_departments(metropole=True)
loc.tail()
On fusionne avec les R.
locdep = GeoDataFrame(depdf.merge(loc, left_on='dep', right_on='code_depart'))
locdep.tail()
Et on dessine. Les départements en vert sont ceux pour lequel le R est > 1.
with warnings.catch_warnings():
    warnings.filterwarnings("ignore", category=UserWarning)
    warnings.filterwarnings("ignore", category=DeprecationWarning)
    fig, axs = plt.subplots(
        1, 2, figsize=(16, 10),
        gridspec_kw={'width_ratios': [2, 1]})

    # métropole
    ax = axs[0]
    cax = make_axes_locatable(ax).append_axes("right", size="5%", pad=0.1)
    locdep.plot(
        column="R", ax=ax, edgecolor='black',
        legend=True, cax=cax, cmap="OrRd")
    if (locdep.R < 1).sum() > 0:
        locdep[locdep.R < 1].geometry.boundary.plot(
            color=None, edgecolor='g', linewidth=2, ax=ax, label="R<1")
    ax.set_title(f"R par départments de la métropole\n{deps.jour.max()!r}")

    for _, row in locdep.iterrows():
        p = row['geometry'].representative_point()
        ax.annotate(f"{row['R']:1.1f}", xy=(p.x, p.y),
                    horizontalalignment='center', color="black", fontsize=8)

    ax.legend()

    # Paris et sa région
    idf = set(['75', '77', '78', '91', '92', '93', '94', '95'])
    ax = axs[1]
    locdep2 = locdep[locdep.dep.isin(idf)]
    cax = make_axes_locatable(ax).append_axes("right", size="5%", pad=0.1)
    locdep2.plot(
        column="R", ax=ax, edgecolor='black',
        legend=True, cax=cax, cmap="OrRd")
    ax.set_title(f"R par départments de la métropole\n{deps.jour.max()!r}")

    for _, row in locdep2.iterrows():
        p = row['geometry'].representative_point()
        ax.annotate(f"{row['R']:1.1f}", xy=(p.x, p.y),
                    horizontalalignment='center', color="black", fontsize=8)

plt.show()
/usr/local/lib/python3.9/site-packages/geopandas/plotting.py:48: ShapelyDeprecationWarning: The 'type' attribute is deprecated, and will be removed in the future. You can use the 'geom_type' attribute instead.
  if geom is not None and geom.type.startswith(prefix) and not geom.is_empty:
/usr/local/lib/python3.9/site-packages/geopandas/plotting.py:48: ShapelyDeprecationWarning: The 'type' attribute is deprecated, and will be removed in the future. You can use the 'geom_type' attribute instead.
  if geom is not None and geom.type.startswith(prefix) and not geom.is_empty:
Total running time of the script: ( 0 minutes 46.073 seconds)