10 plotting libraries#
Links: notebook, html, PDF, python, slides, GitHub
Review of plotting libraries.
xavier.dupre AT gmail.com
Senior Engineer at Microsoft France on Azure ML, Teacher in Computer Science at the ENSAE
![]()
![]()
Objectives of this talk
Nobody makes plot without an existing library anymore.
How to choose a plotting library ?
List of available options
How to extend an existing library ?
How to wrap a javascript library ?
from jyquickhelper import add_notebook_menu
add_notebook_menu(last_level=2)
Material
Notebooks for this talk: http://www.xavierdupre.fr/…
Teachings at ENSAE: Python pour un Data Scientist
Microsoft, Python and Open Source
2014/11: .NET Core is Open Source
2015/07: Python Tools for Visual Studio moves to Github
2016/06: Build Machine Learning applications to run on Apache Spark clusters on HDInsight Linux
2016/06: azure-sdk-python 2.0.rc4: Python interface to access Azure services
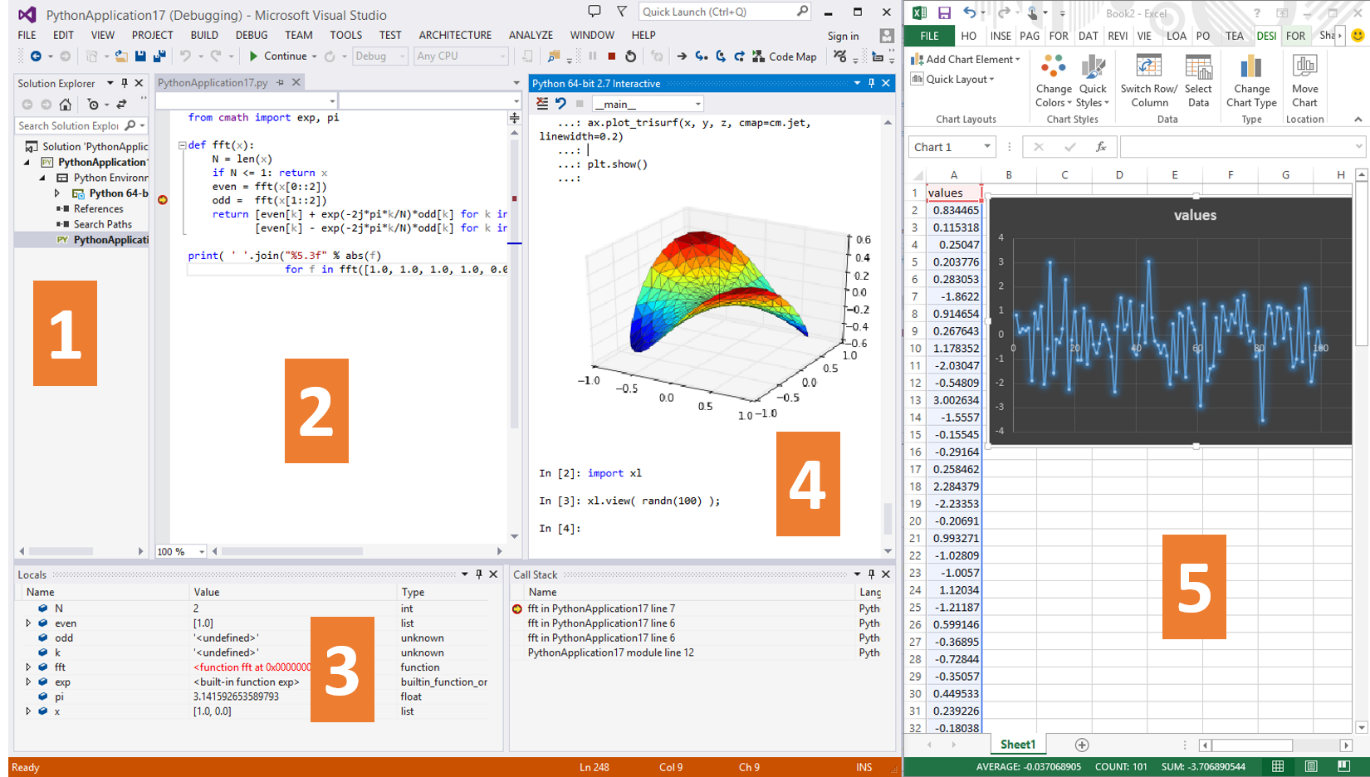
ptvs#
Microsoft in Data Science
Microsoft is one of the sponsors of the DataScienceGame
Elements of decision#
add_notebook_menu(keep_item=0)
Graph language#
We like them because we read them faster.
%matplotlib inline
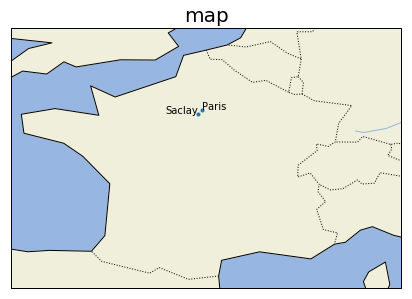
from jupytalk.talk_examples.pydata2016 import example_cartopy
ax = example_cartopy()
ax.set_title("map", size=20);
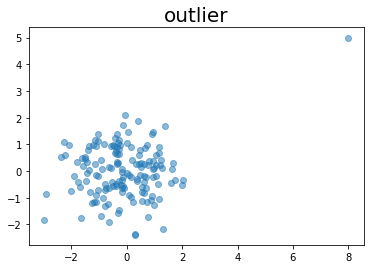
import numpy, matplotlib.pyplot as plt
N = 150
x, y = numpy.random.normal(0, 1, N), numpy.random.normal(0, 1, N)
x[-1], y[-1] = 8, 5
plt.scatter(x, y, alpha=0.5)
plt.title("outlier", size=20)
Text(0.5,1,'outlier')
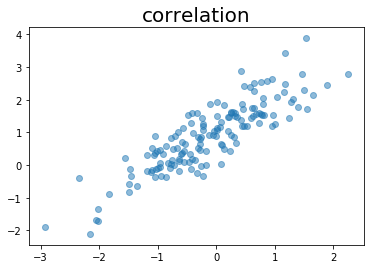
import numpy, matplotlib.pyplot as plt
N = 150
x = numpy.random.normal(0, 1, N)
y = x + numpy.random.normal(0, 0.5, N) + 1
plt.scatter(x, y, alpha=0.5)
plt.title("correlation", size=20)
Text(0.5,1,'correlation')
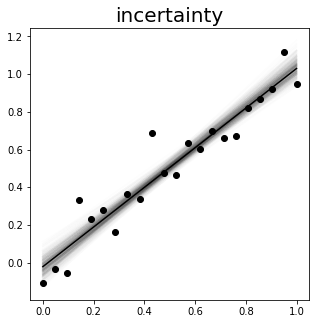
from jupytalk.talk_examples.pydata2016 import example_confidence_interval
ax = example_confidence_interval()
# https://github.com/sdpython/jupytalk/blob/master/src/jupytalk/talk_examples/pydata2016.py
ax.set_title("incertainty", size=20)
Text(0.5,1,'incertainty')
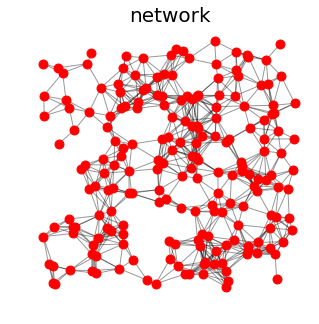
from jupytalk.talk_examples.pydata2016 import example_networkx
ax = example_networkx()
# https://github.com/sdpython/jupytalk/blob/master/src/jupytalk/talk_examples/pydata2016.py
ax.set_title("network", size=20)
Text(0.5,1,'network')
Why so many?#
Every domain has its own data representation (statistics, machine learning, biology, maps…)
Many supports (images, web sites, notebooks)
High volume of data requires specific solution (maps)
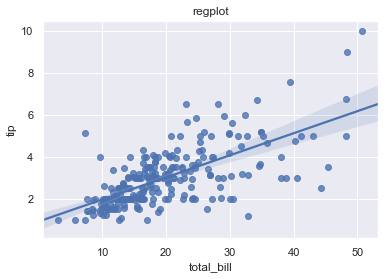
Example: seaborn#
collection of plots used for any new projects
See regplot.
import seaborn; seaborn.set(color_codes=True)
tips = seaborn.load_dataset("tips")
ax = seaborn.regplot(x="total_bill", y="tip", data=tips)
ax.set_title("regplot")
c:python370_x64libsite-packagesscipystatsstats.py:1713: FutureWarning: Using a non-tuple sequence for multidimensional indexing is deprecated; use arr[tuple(seq)] instead of arr[seq]. In the future this will be interpreted as an array index, arr[np.array(seq)], which will result either in an error or a different result.
  return np.add.reduce(sorted[indexer] * weights, axis=axis) / sumval
Text(0.5,1,'regplot')
Why using a programming language to plot?#
Justification |
Case |
|---|---|
automate complex graph |
update a presentation |
share customized graph |
easier to read among a team, build a common graph language |
combine data processing and plotting |
handle huge volume of data |
What did Internet change?#
Remote access: interact with the graph cheaper than drawing again
Many plotting libraries: javascript plotting libraries
Impact of notebook on Python#
Before: graphs libraries were mostly static (images)
After: graphs are now interactive
Notebook can easily leverage javascript libraries
Decisions#
Decision 1: the audience?
The plot is just for you?
The plot will be inserted in a report? In a PowerPoint presentation?
The plot will be internally shared?
The plot will be shared with customers on a website?
Decision 2: which volume of data to plot?
How many points to draw 10.000, 1M, 1B?
How fast do you need to draw?
Do you need to preprocess the data?
Decision 3: which technology?
static (image, PDF, no zoom)
matplotlib based
reportlab based
Pillow based
interactive (zoom, move, not always great in a book)
javascript based
Python and javascript based
pure javascript (if you don’t find what you want)
from a notebook
from a web page
Final check: is the library maintained?
License: is it free only for research?
Source are available on github: is the last commit recent?
The library was mentioned in a conference.
The library is used by many others to create customized graphs?
It works on many platforms.
The documentation is great.
Libraries for static plots
add_notebook_menu(keep_item=1)
Static never fails#
Images works anywhere
Images are self contained
Easy to combine
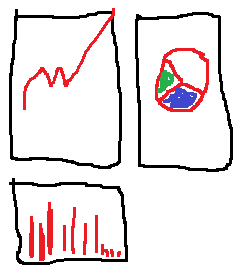
combine#
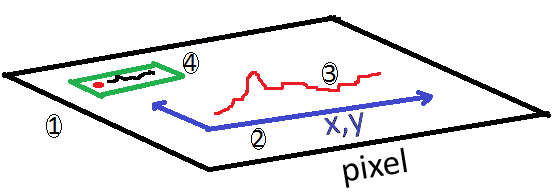
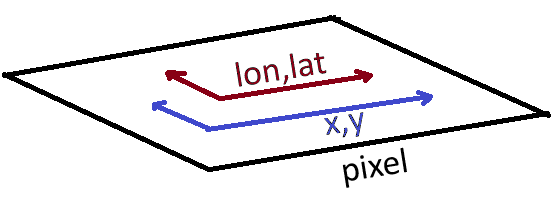
Five steps to plot#
Create a figure: pixel system.
Create Axis: coordinate system.
Draw inside the plotting area
Add element outside the plotting area
Render the image.
step5#
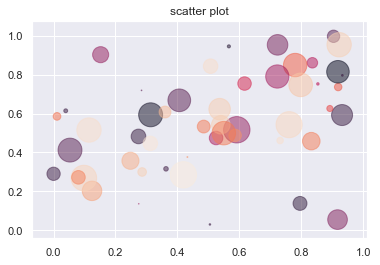
matplotlib for all#
matplotlib: the standard
import numpy as np, matplotlib.pyplot as plt
N = 50
x, y, colors = np.random.rand(N), np.random.rand(N), np.random.rand(N)
area = np.pi * (15 * np.random.rand(N))**2
fig, ax = plt.subplots()                       # steps 1, 2
ax.scatter(x, y, s=area, c=colors, alpha=0.5)  # step 3
ax.set_title("scatter plot")                   # step 4
fig.savefig("example_scatterplot.png")         # step 5
networkx for networks#
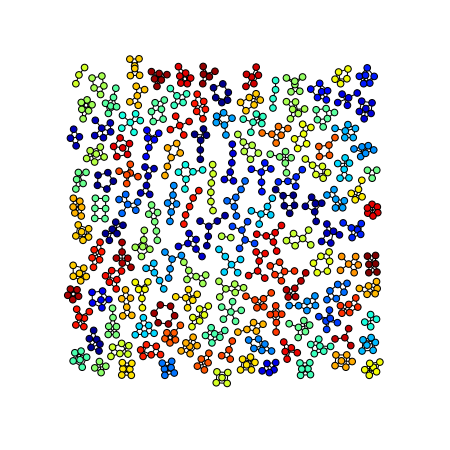
networkx#
seaborn for statistics#
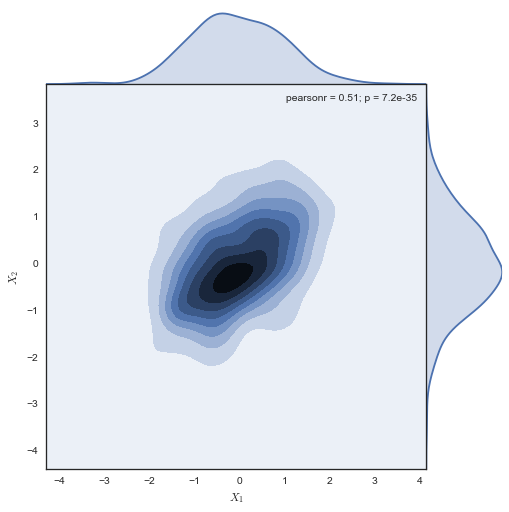
seaborn#
basemap for maps#
. |
|
|---|---|
|
|
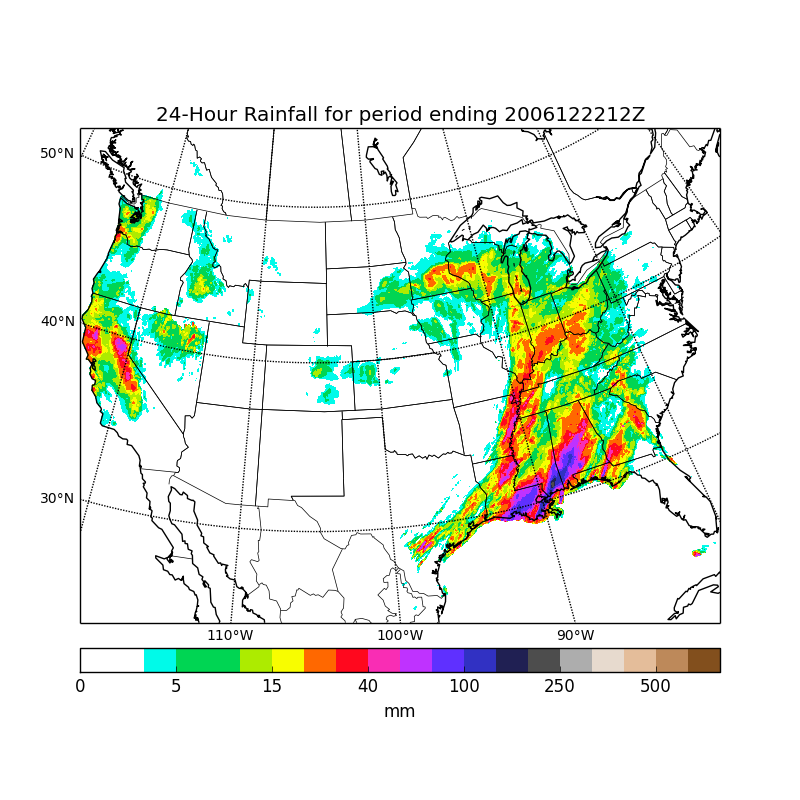
See also cartopy
ete3 for trees#
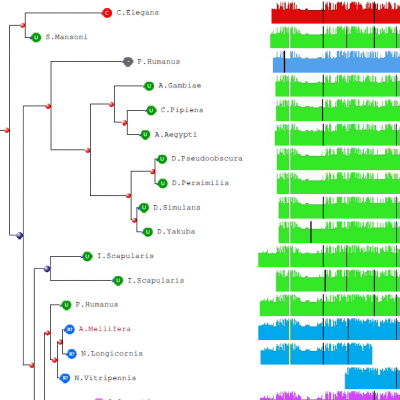
ete3#
reportlab for pdf#
reportlab: standard for PDF
reprotlab#
plotnine for the syntax#
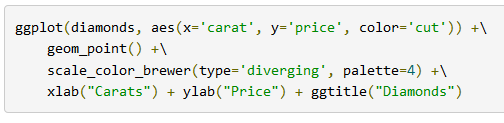
plotnine#
plotnine#
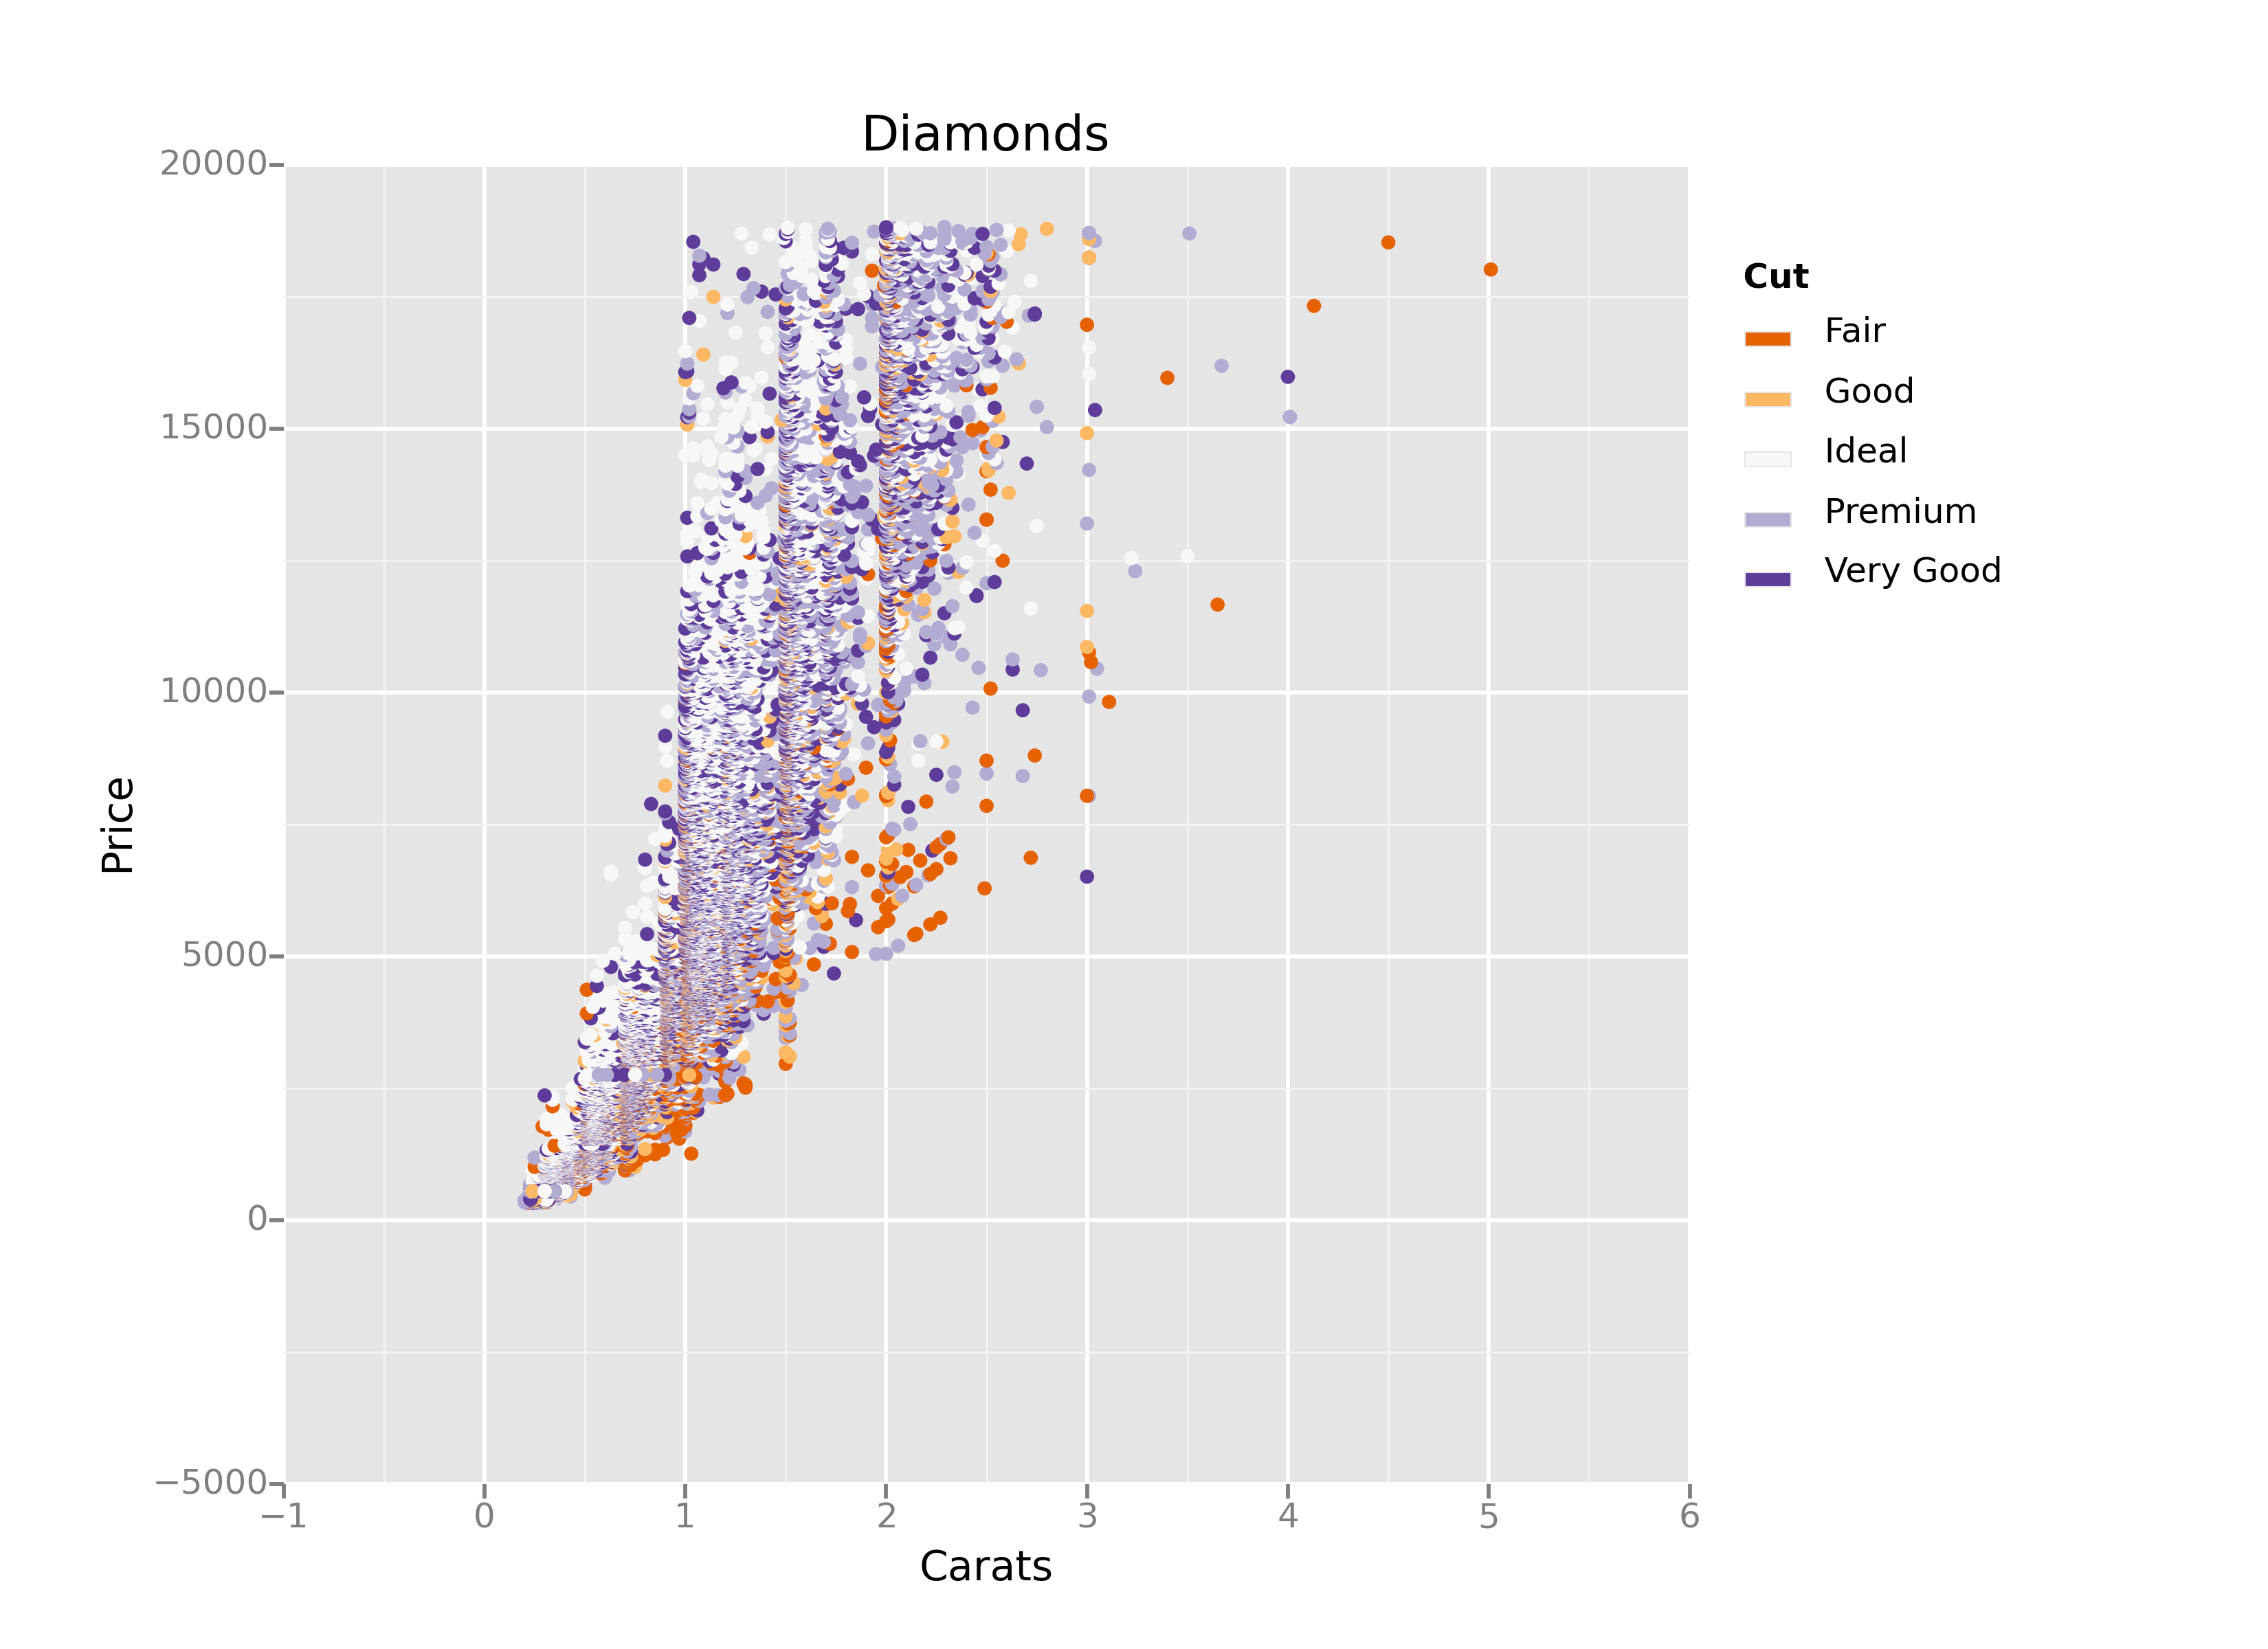
missingno for the missing values#
missingno#
biopython for genes#
biopyhon#
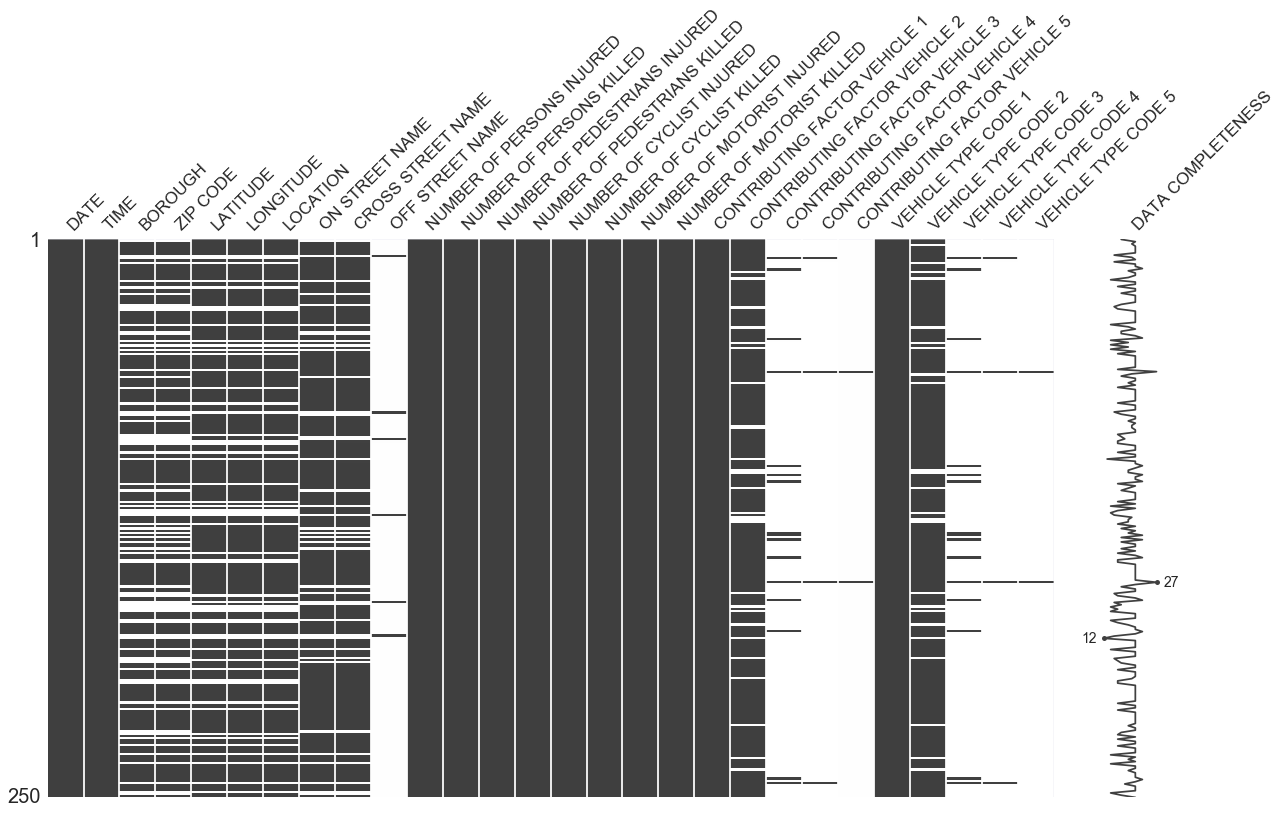
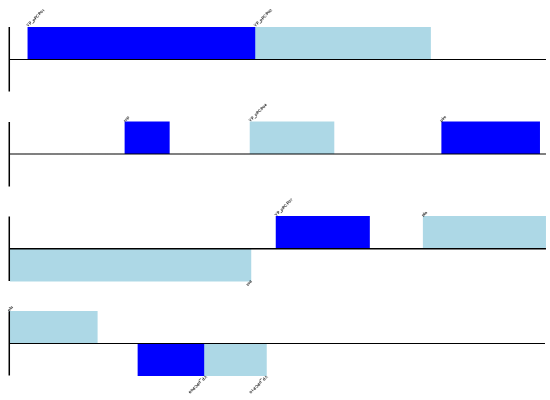
lifelines for survival analysis#
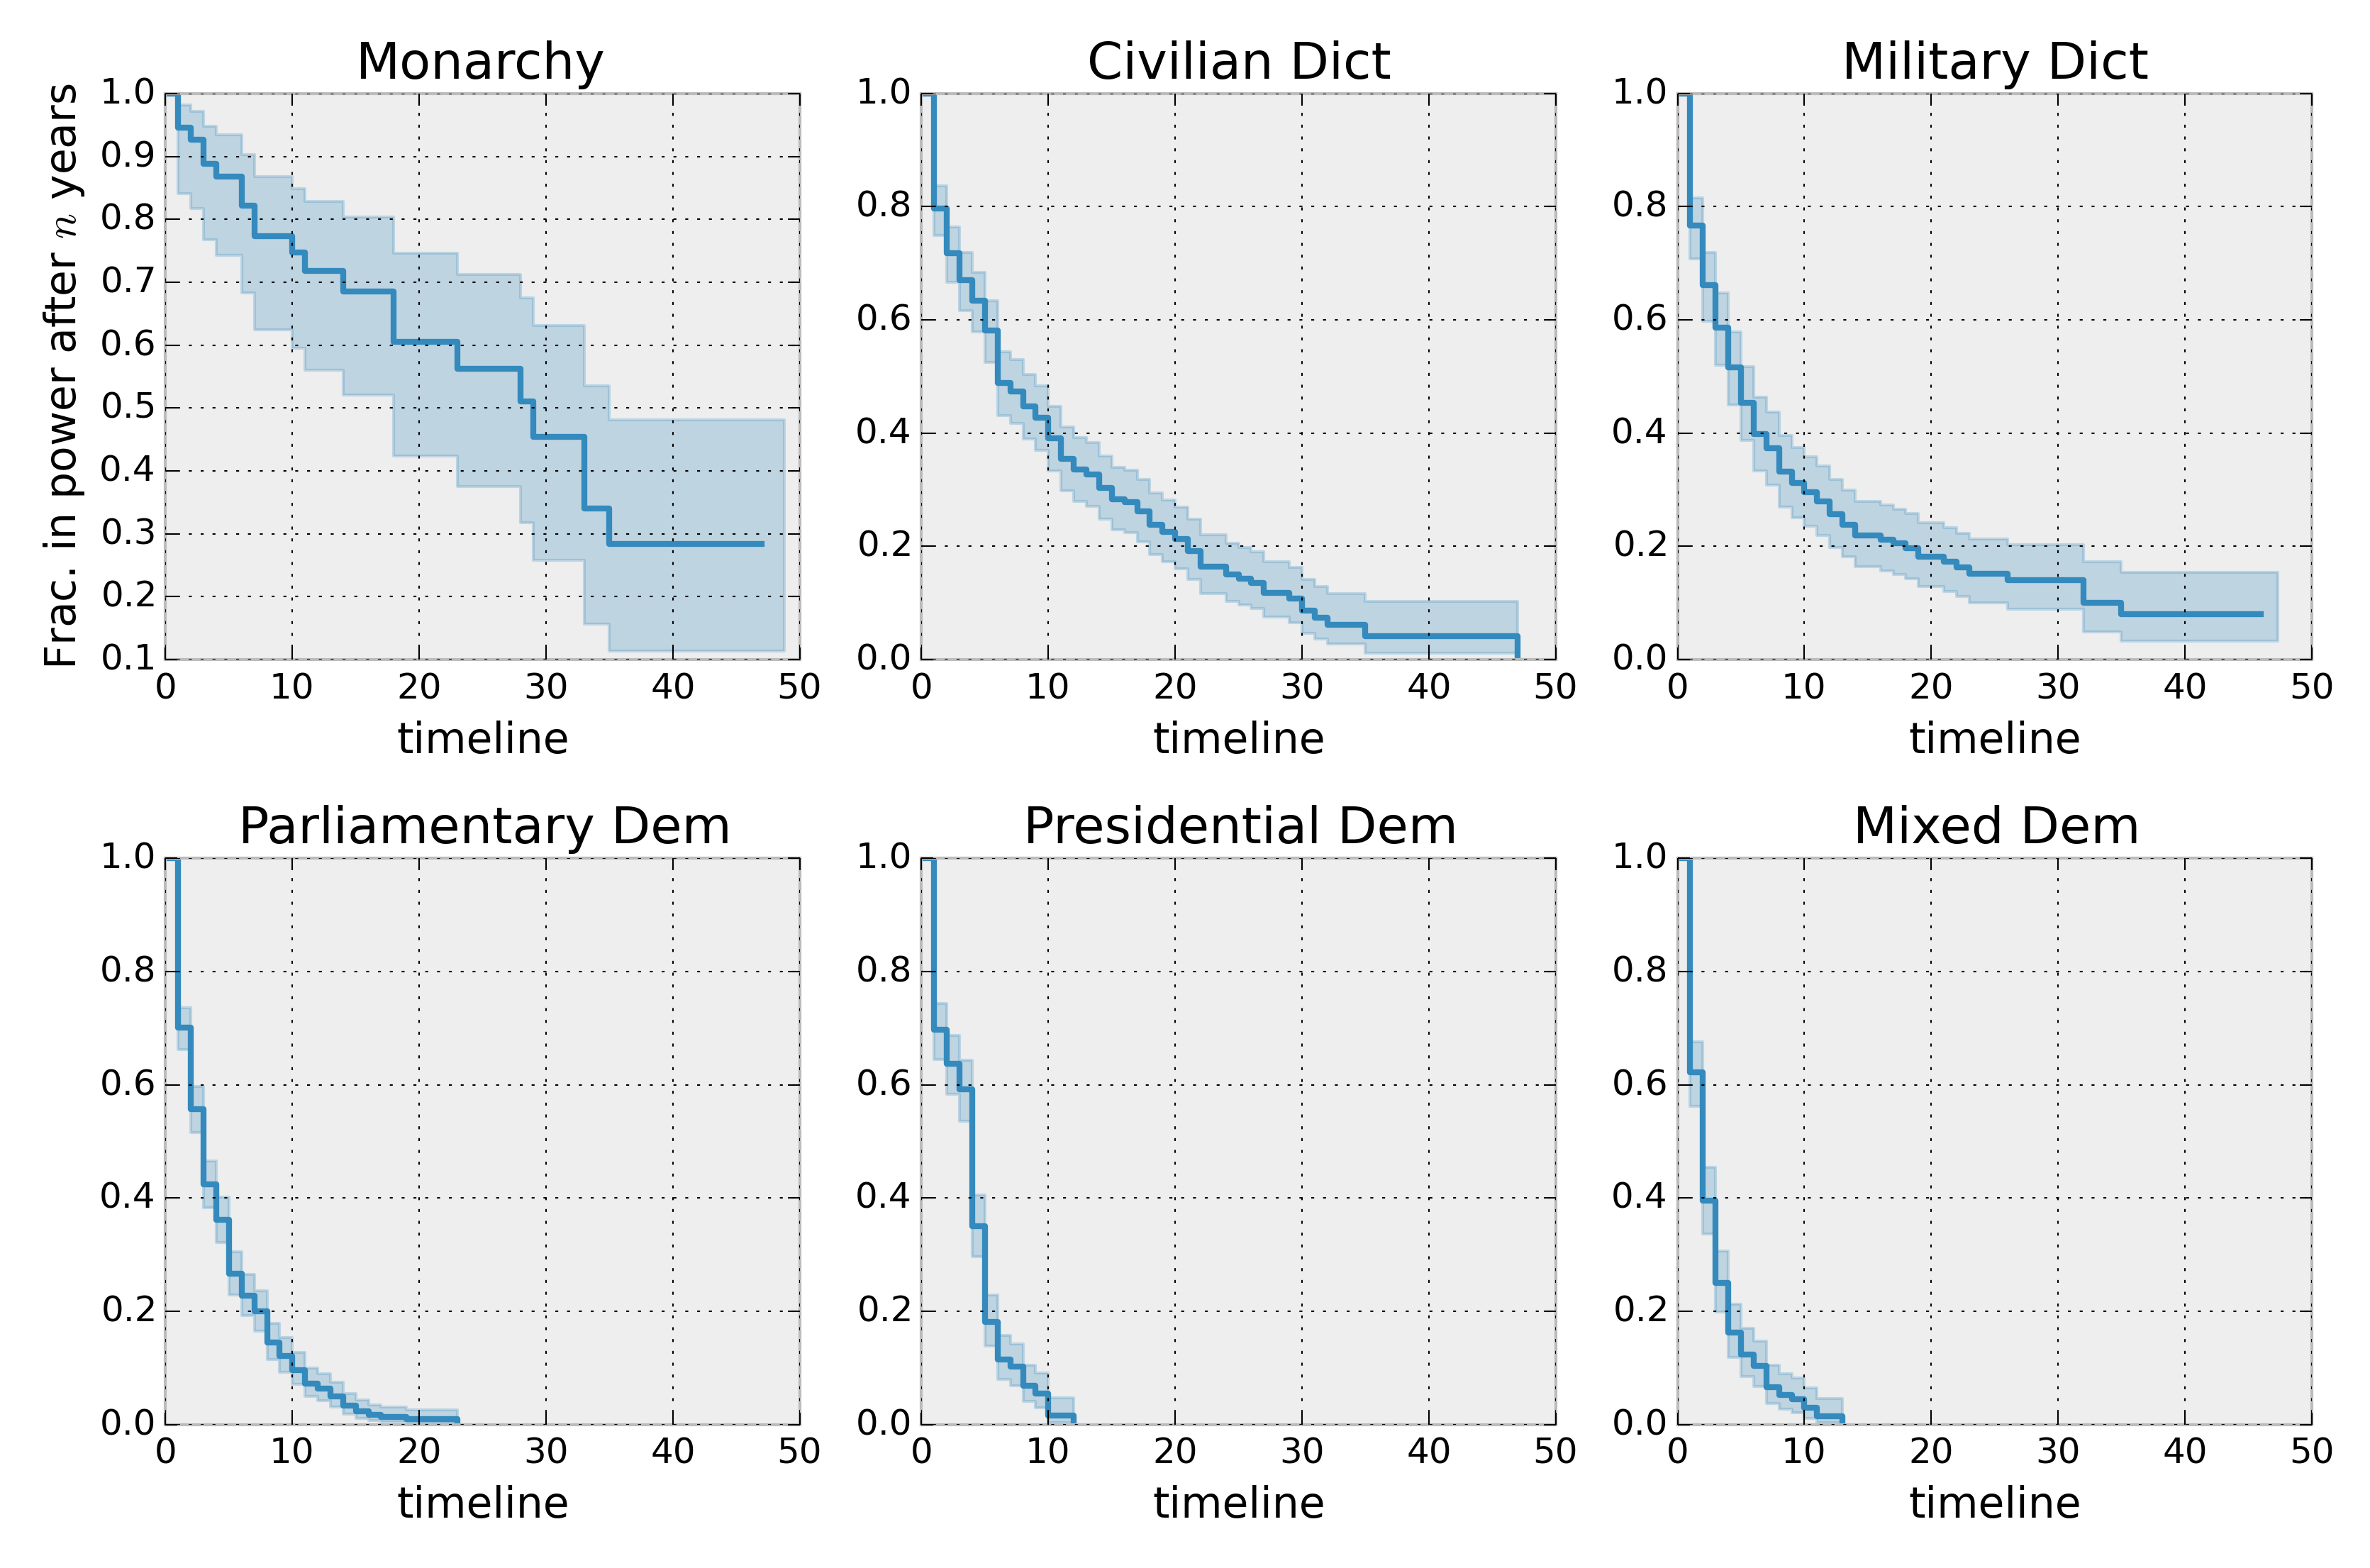
lifelines#
In short#
Many libraries available in many domains.
Many scripts available (github, stackoverflow)
Look for the gallery.
Pick the closest graph to your needs
Tweak
Libraries for interactivity
add_notebook_menu(keep_item=2)
Interactivity is javascript#
A browser is needed
A server might be needed (bqplot)
Better to know javascript
Steps to plot#
Create a figure:
Create Axis: coordinate system
Draw inside the plotting area
Add elements outside the plotting area
Implement interactivity if not automated
Write the corresponding HTML, Javascript code
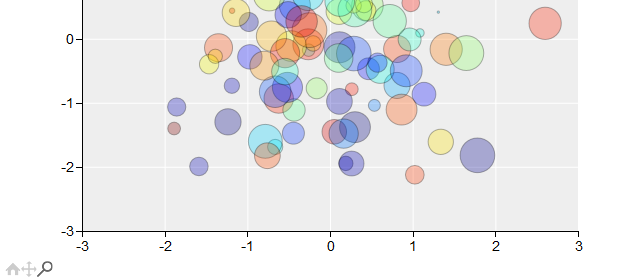
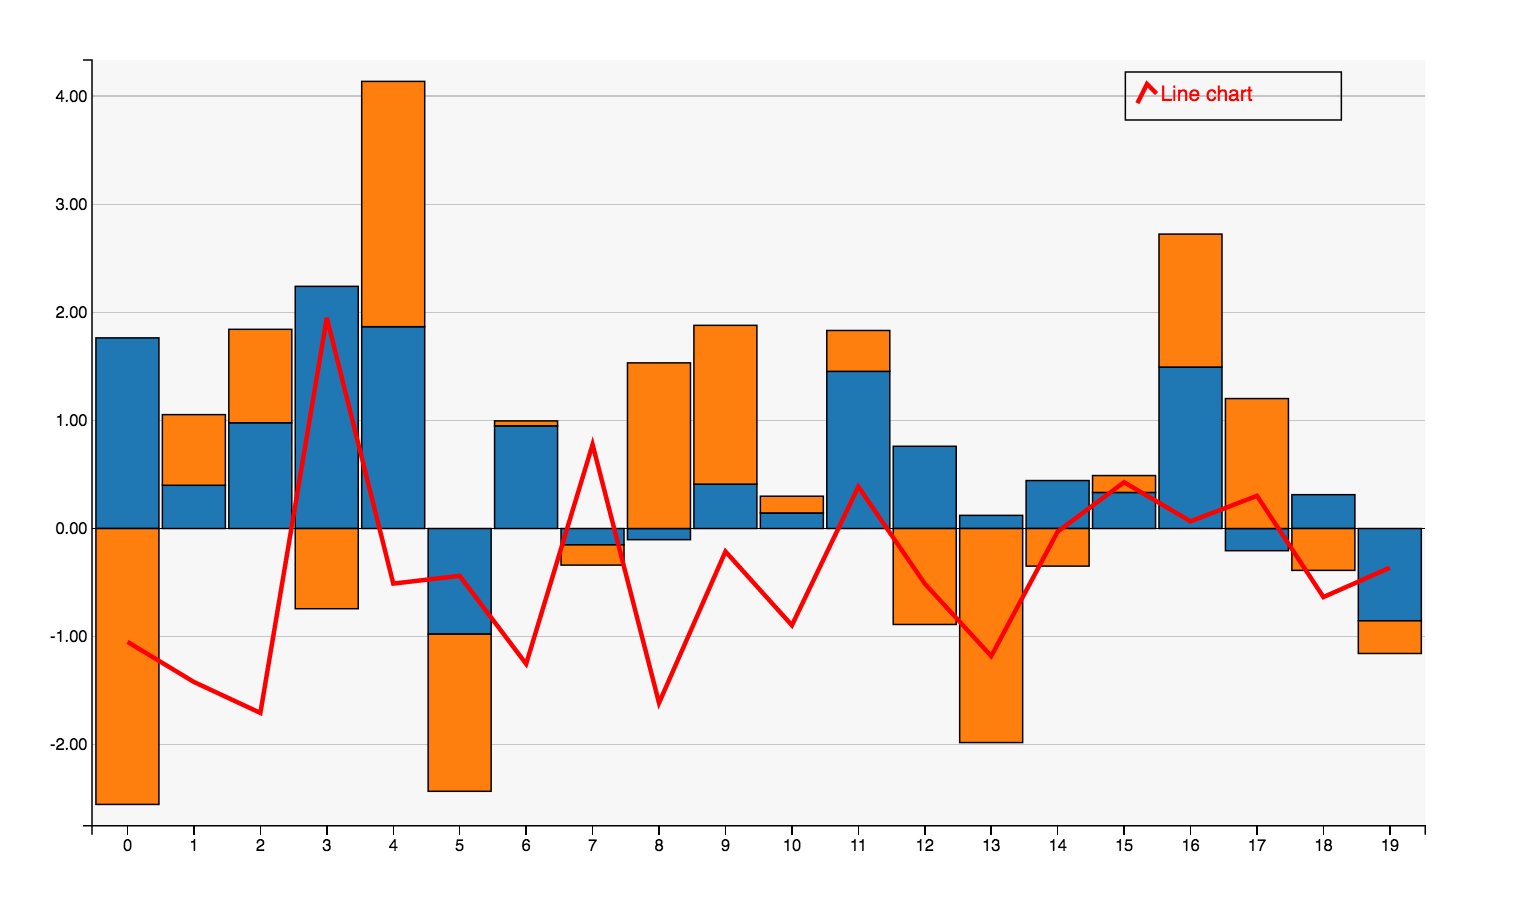
bokeh for all#
bokeh default interactivity: zoom, move, reset ; custom python, javascript
bokeh#
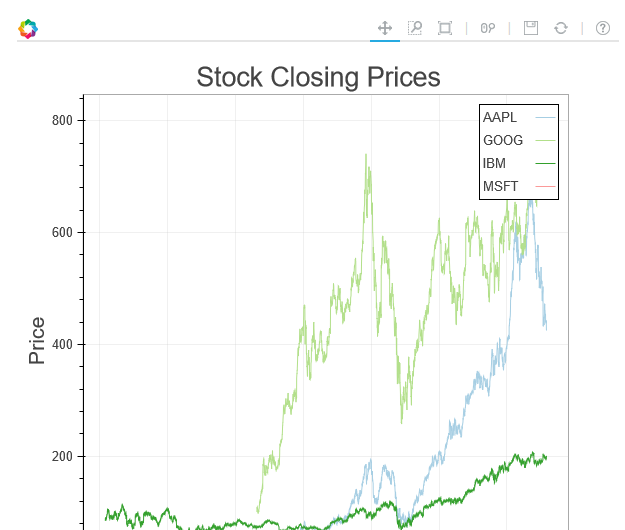
plotly for its design#
plotly default interactivity: zoom, move, reset, text popup ; plus integration with pandas
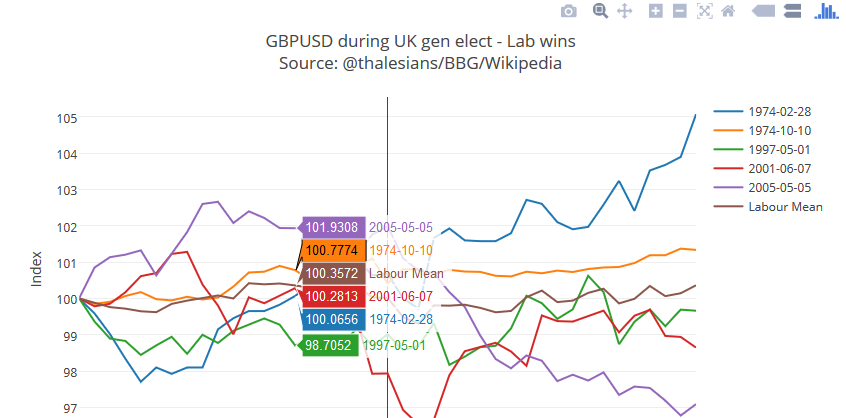
plotly#
mpld3 for matplotlib#
mpld3 = matplotlib in javascript default interactivity: zoom, move, reset custom python, javascript (simple)
mpld3#
python-lightning for its simplicity#
python-lightning also works with R default interactivity: zoom, move, reset, text popup
lightning#
pygal, leather for SVG#
pygal leather default interactivity: text popup
pygal#
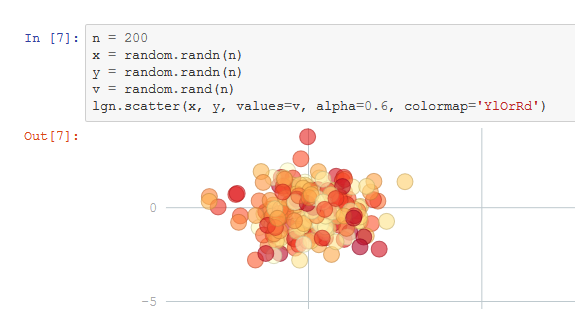
vega for its simplicity#
vega default interactivity: text popup
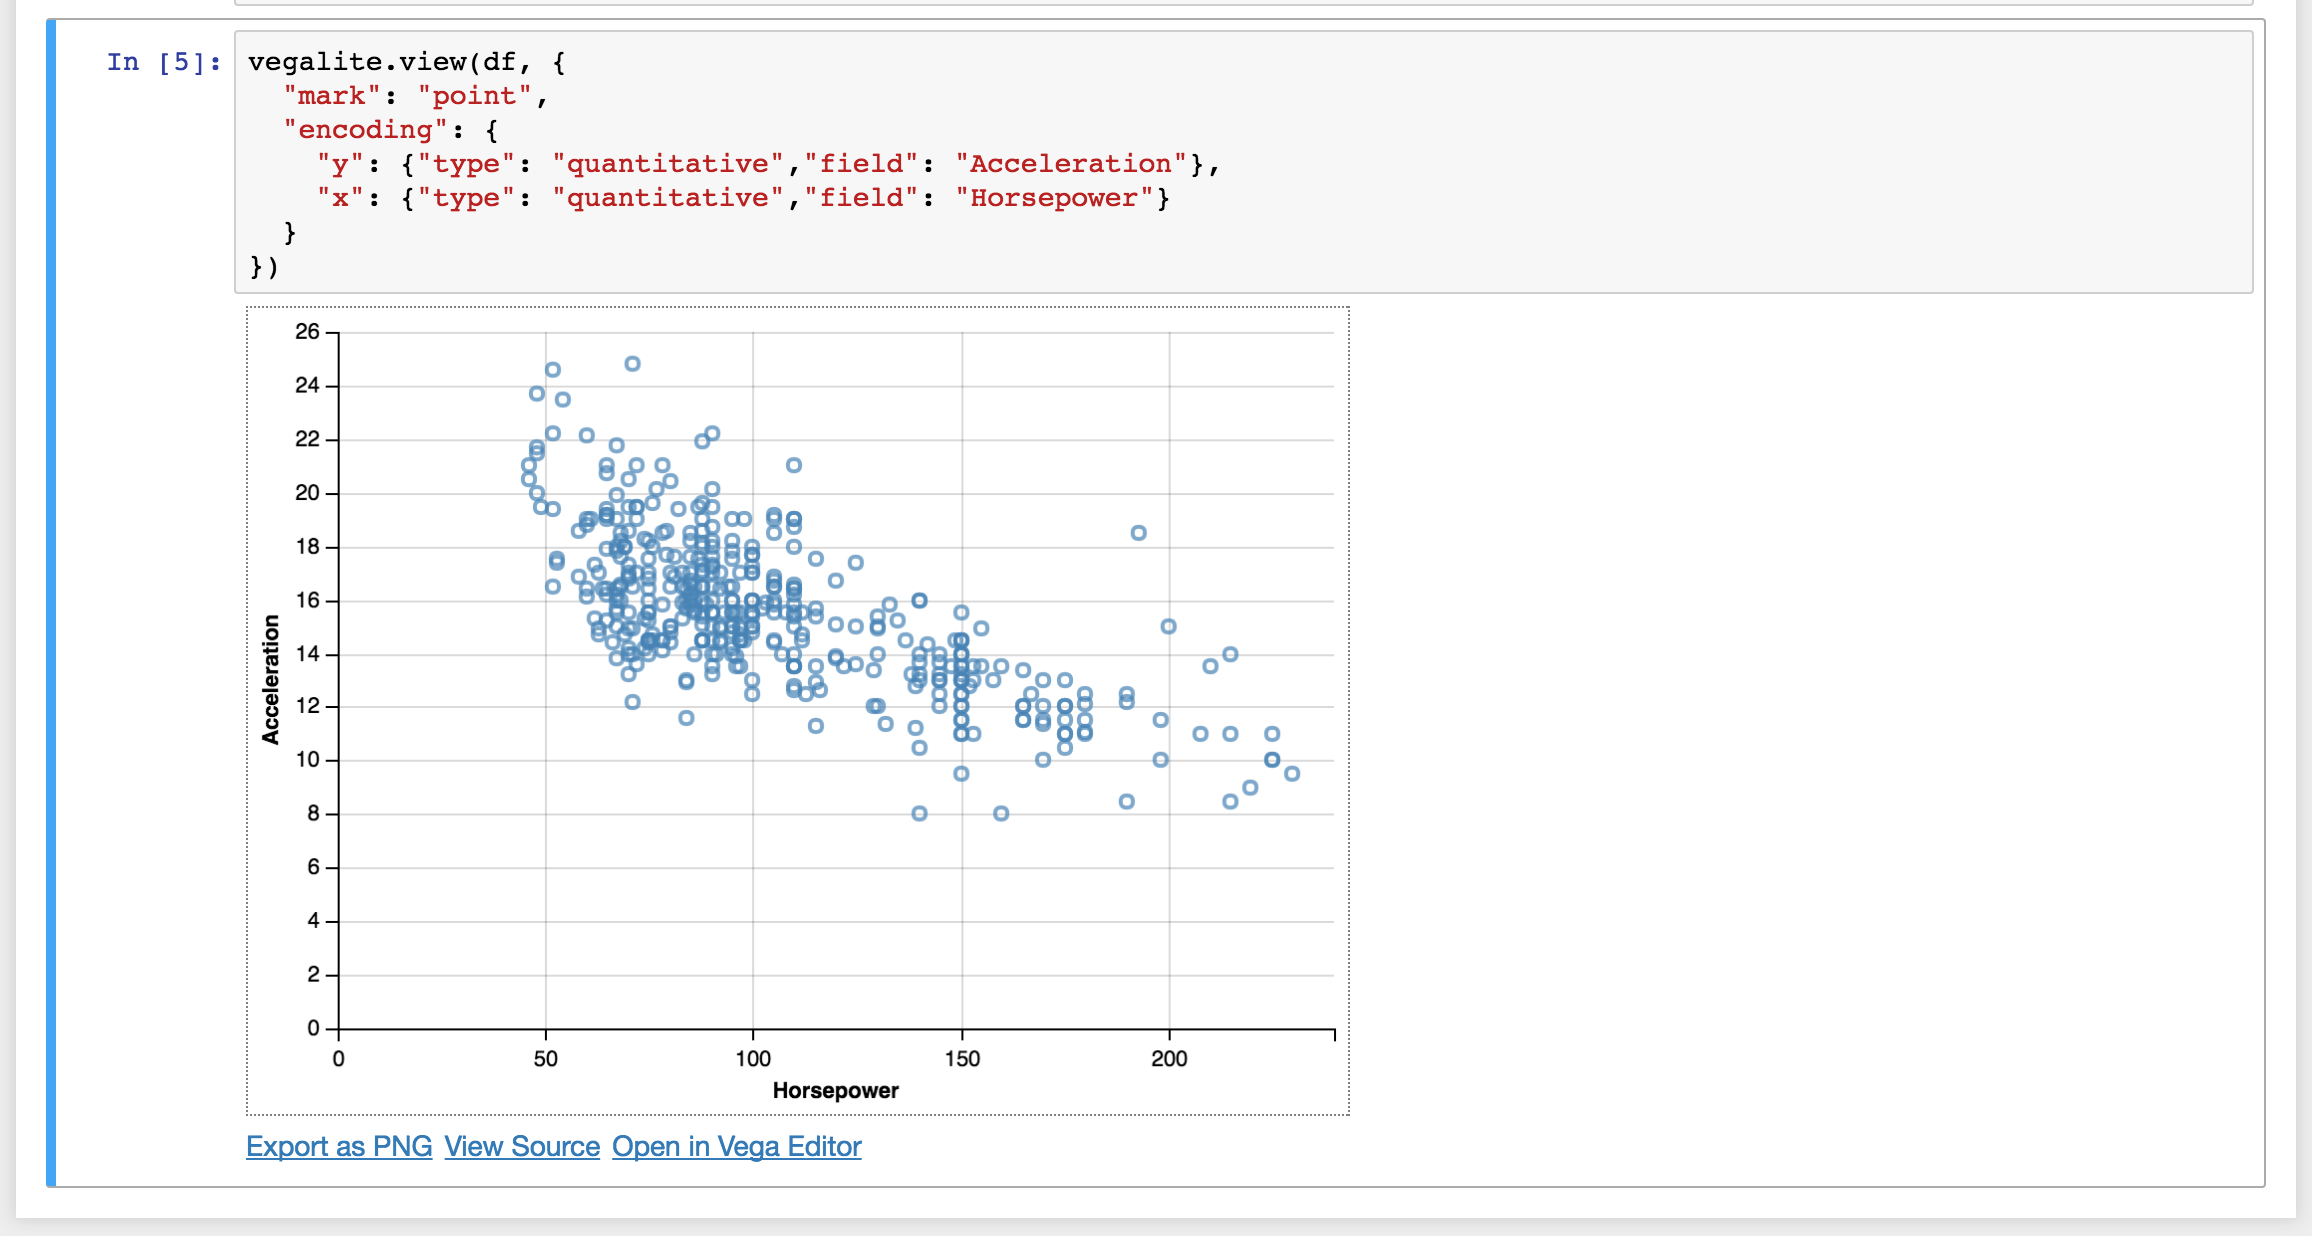
vega#
folium for maps#
folium = map with OpenStreetMap default interactivity: zoom, move, reset custom text popup, marker
import folium
center = [48.862, 2.346]
paris = folium.Map(center, zoom_start=13)
folium.Marker(center, popup='Les Halles').add_to(paris)
paris
pythreejs for 3D#
pythreejs default interactivity: zoom, move, rotate, reset
pythreejs#
pydy for mechanics#
pydy default interactivity: visualize a scene
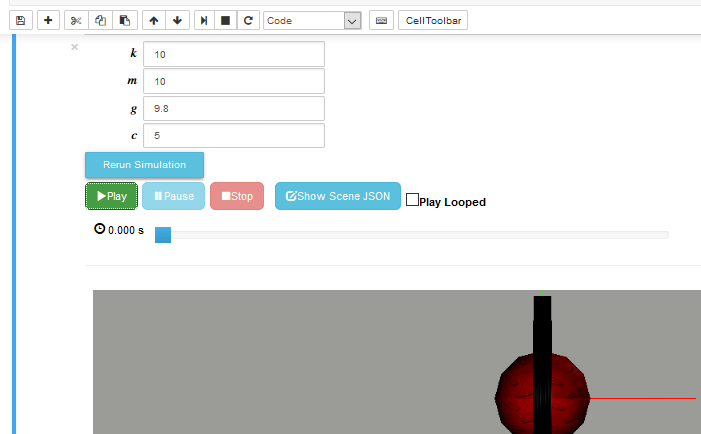
pydy#
In short#
Are you looking for?
Standard interactivity (all of them)
Custom interactivity (Python, Javascript) (bokeh)
Easy export to websites (SVG, vega)
Libraries mixing Javascript, Python, …
add_notebook_menu(keep_item=3)
Hide the complexity#
Mix of technologies
Wrapped in one module
Easy examples
But cryptic bugs for newbies
bqplot for the interactions in python#
bqplot#
brython, bythonmagic to avoid javascript#
Magic command %%brython%%
easy to modify the notebook with Python
no javascript
place to start if you don’t like javascript
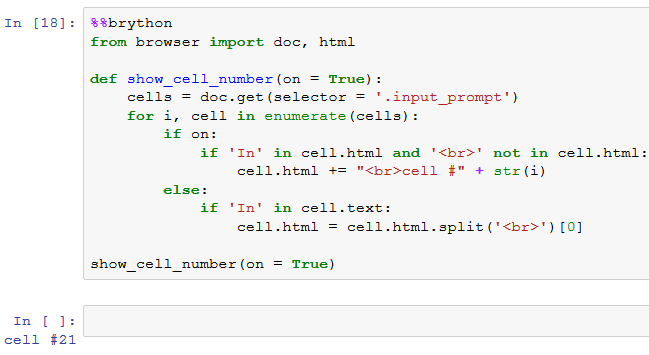
brython#
geoplotlib for maps in a GUI#
geoplotlib#
vispy for computational graphics#
http://vispy.org/installation.html creates graphs demanding heavy computation. It requires the knowledge of C++.

vispy#
In short#
Very suitable for research purpose
Uneasy to export the results
Libraries for high volume of data
add_notebook_menu(keep_item=4)
Challenge#
Two extremes:
Plotting huge volume takes time to process
Interactivity requires fast processing
Compromise?
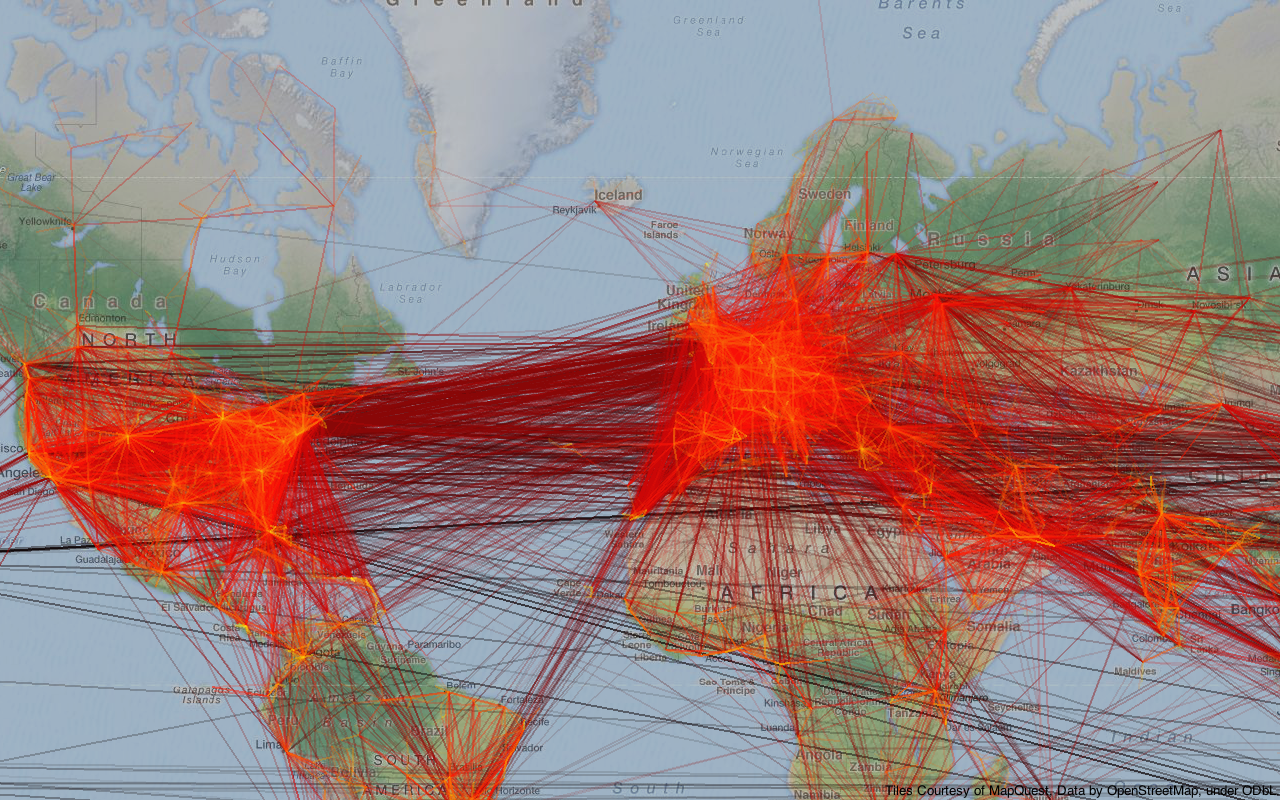
datashader
datashader = bokeh + Python interaction + data interpolation
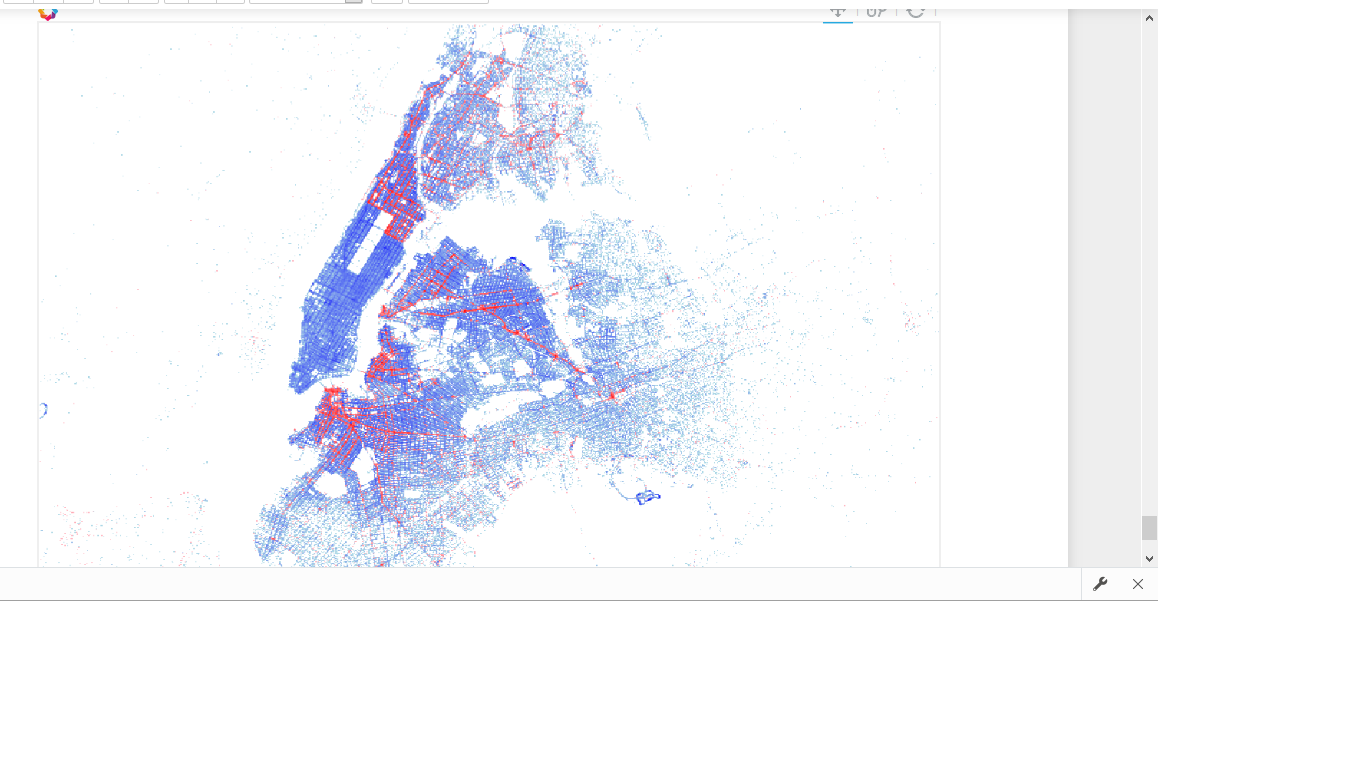
datashader#
In short#
Work in progress.
Deeper into programming#
add_notebook_menu(keep_item=5)
Extend an existing library#
Follow existing design
Constraints:
Add the plot to an existing one
Add complementery elements
Wrong design#
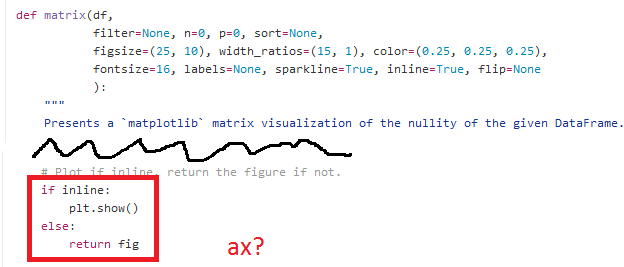
wrong#
Right design#
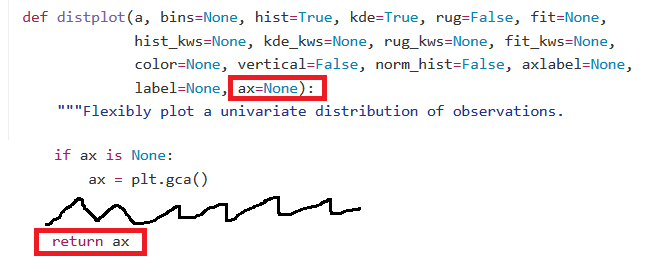
right#
Parameter ax#
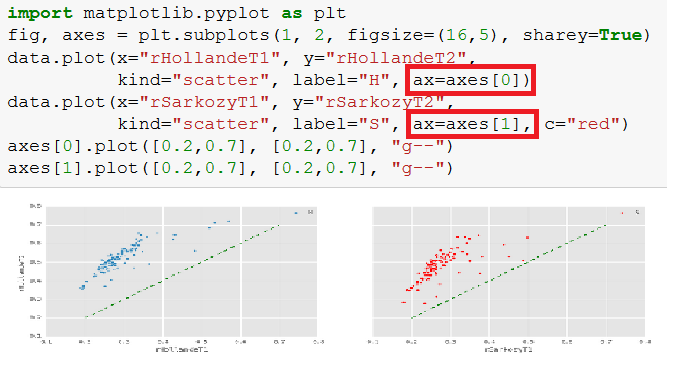
subplots#
Wrapping a javascript library#
Chosen from 10 JavaScript libraries to draw your own diagrams
Search for
python + <library>
Dummy example with treant#
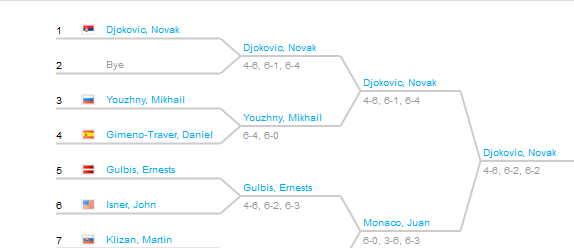
treant#
Part 1: HTML#
a DIV with an id
a script for the library
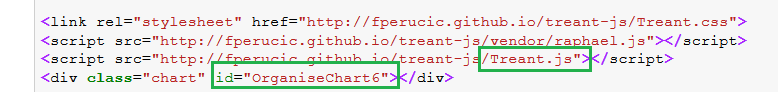
html#
Part 2: Json data#
JSON most of the time
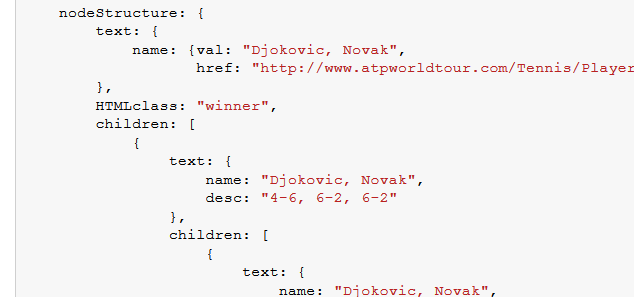
json#
Part 3: javascript#
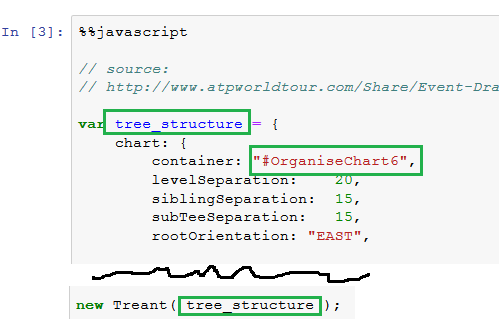
js#
In short#
Pratice with existing libraries first
Think about others users
Conclusion#
Static images are not obsolete!
Interactivity still requires a bit of work.
Huge volume of data is still a work in progress
Easy to create your own library
Un bon croquis vaut mieux qu’un long discours. Napoléon Bonaparte
This is only the beginning
Thank you
xavier.dupre AT gmail.com