Notebooks Gallery#
2016#
centrale#
|
Présentation à Centrale Paris - Juin 2016. |
|
|
Short examples on how to connect to a cluster from a notebook and submit a job (Azure + PIG). |
|

|
Quelques pistes sur le fonctionnement des moteurs de recommandations sur le web. |
ensae#

|
Les gagnants des compétitions Kaggle décrivent parfois leurs solutions sur le blog de Kaggle No Free Hunch. Il y a toujours de bonnes idées à glaner. |
pydata#
|
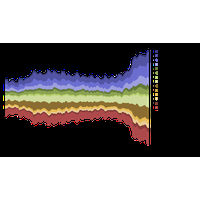
Review of plotting libraries. |
|

|
The Biopython Project is an international association of developers of freely available Python tools for computational molecular biology. |
|
|
bokeh is one if the most mature and complete library using javascript. |
|

|
This library is well integrated with Jupyter and will probably stick for a long time. It mixes Python and Javascript. One drawback: you need to run the notebook everytime to get the graph, they don’t stay because Jupyter server is sending them, they don’t appear in the output. |
|
|
brython is an implementation of Python in javascript, byrthonmagic makes it available from a notebook. |
|
|
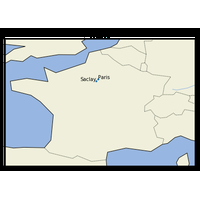
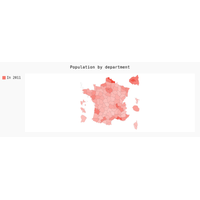
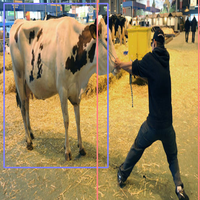
cartopy aims at drawing maps based on matplotlib. It superimposes a geographical coordinate system on the top of matplotlib’s one. It is usually used with modules such as pyproj to handle shapefiles also with shapely or geopandas, fiona, descartes. |
|

|
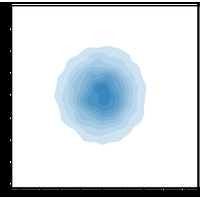
datashader plots huge volume of data. |
|
|
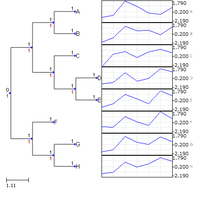
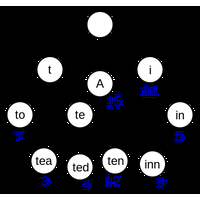
ete3 draws nice trees. |
|
|
geoplotlib implements its own GUI to visualize maps. |
|
|
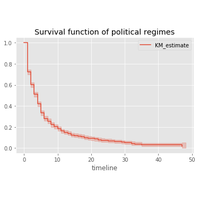
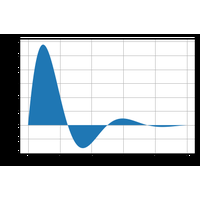
lifelines implements methods and algorithm for life insurance. As many dedicated module, it contains custom graphs built on the top of matplotlib for this module. |
|
|
lightning-python is a wrapper for the javascript library lightning. |
|
|
matplotlib is the most used to plot. It is the reference. |
|
|
missingno represents missing values in dataframe. |
|
|
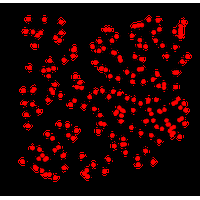
mpl-scatter-density speeds up density graph. matplotlib is very slow when it comes to draw millions of points. datashader is one alternative but was meant for zooming/dezooming. This package provides a simple functionality. The example comes the documentation. |
|
|
mpld3 is taking matplotlib graphs and converts them into javascript. the support was stopped in Summer 2017. This notebook should be failing at some point is not checked anymore on regular basis. |
|
|
networkx draws networks. It does not work too well on big graphs (< 1000 vertices). |
|
|
plotly became open source - it was not at the beginning -, it proposes a large gallery of javascript graphs. plotly also offers to host dashboards built with plotly. |
|
|
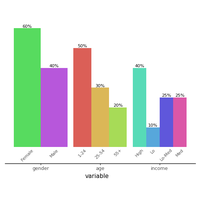
plotnine is an extension of ggplot. The language makes it to compose the data with the layout. I replicate the example from the gallery Two Variable Bar Plot. |
|

|
pydy simulates physical systems. |
|
|
pyecharts a wrapper for a new library echarts made by Baidu. |
|
|
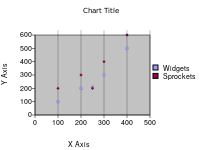
pygal is one if the most mature and complete library using javascript. |
|
|
pythreejs allows 3D interactive graphs in a notebook. |
|
|
reportlab is the best option if you want to draw graph directly in PDF. Otherwise, code is usually longer with this module compare to matpotlib for example. |
|
|
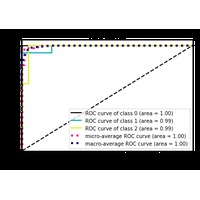
scikit-plot is an extension of matplotlib for datascientist. Proposed graphs are a frequent need when playing with data. |
|
|
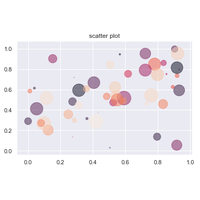
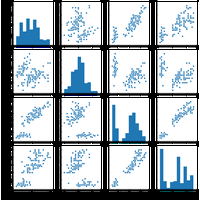
seaborn is an extension of matplotlib for statisticians. Graphs are really nice and famous among statisticians. However, it is difficult to draw a graph with weighted observations. |
|
|
treant-js is a javascript library to plot diagram and trees. The goal is to wrap it as a library for python. |
|
|
vega is an extension for the notebook which relies on Vega. |
|

|
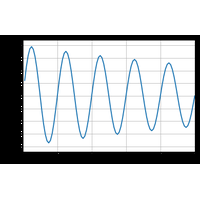
vispy builds graph demanding heavy computation. It does not work well from a notebook. |
2017#
ensae#

|
Le data scientiste est devenu populaire. |
|

|
Les gagnants des compétitions Kaggle décrivent parfois leurs solutions sur le blog de Kaggle No Free Hunch. Il y a toujours de bonnes idées à glaner. |
meshs#
|
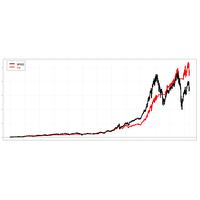
L’exemple du trading algorithmique. |
2018#
msexp#

|
Xavier Dupré - Senior Data Scientist at Microsoft - Computer Science Teacher at ENSAE |
pyparis#
|
Xavier Dupré - Senior Data Scientist at Microsoft - Computer Science Teacher at ENSAE |
2019#
ensae_api#
|
scikit-learn est devenu le module incontournable quand il s’agit de machine learning. Cela tient en partie à son API épurée qui permet à quiconque d’implémenter ses propres modèles tout permettant à scikit-learn de les manipuler comme s’il s’agissait des siens. |
sklearn#
|
The notebook explains how to create a converter for a custom transformer following scikit-learn API. |
|
|
The notebook explains what ONNX is and how it can be used combined with sklearn-onnx and onnxruntime. ONNX is a serialization format for machine learning models. |
2020#
ensae#
|
La programmation est devenue un outil essentiel du datascientist mais pas seulement. Beaucoup d’outils pointus sont open source mais uniquement accessibles à ceux qui savent programmer. Après la mise au point d’un modèle statistique, économique, il se pose souvent la question de la mise à jour fréquente des résultats, c’est à dire leur automatisation via la programmation. |
2021#
actuaires#
|
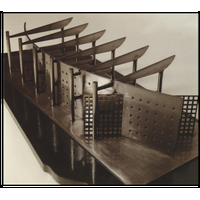
Des années 1970 à la datascience d’aujourd’hui. |