cartopy#
Links: notebook, html, PDF, python, slides, GitHub
cartopy aims at drawing maps based on matplotlib. It superimposes a geographical coordinate system on the top of matplotlib’s one. It is usually used with modules such as pyproj to handle shapefiles also with shapely or geopandas, fiona, descartes.
documentation source installation tutorial gallery
%matplotlib inline
from jyquickhelper import add_notebook_menu
add_notebook_menu()
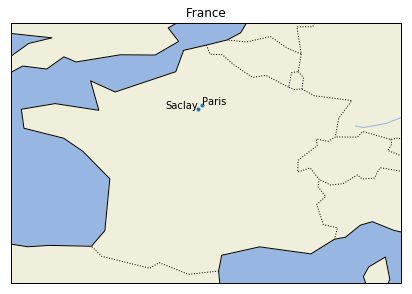
example#
import cartopy.crs as ccrs
import cartopy.feature as cfeature
import matplotlib.pyplot as plt

fig = plt.figure(figsize=(7,7))
ax = fig.add_subplot(1, 1, 1, projection=ccrs.PlateCarree())
ax.set_extent([-5, 10, 42, 52])

ax.add_feature(cfeature.OCEAN)
ax.add_feature(cfeature.COASTLINE)
ax.add_feature(cfeature.RIVERS)
ax.add_feature(cfeature.LAKES)
ax.add_feature(cfeature.LAND)
ax.add_feature(cfeature.BORDERS, linestyle=':')
ax.plot([2.35, 2.20], [48.85, 48.71], '.')
ax.text(2.35, 48.85, "Paris")
ax.text(2.20, 48.71, "Saclay", ha="right")
ax.set_title('France');