Note
Click here to download the full example code
Measuring CPU performance#
Processor caches must be taken into account when writing an algorithm, see Memory part 2: CPU caches from Ulrich Drepper.
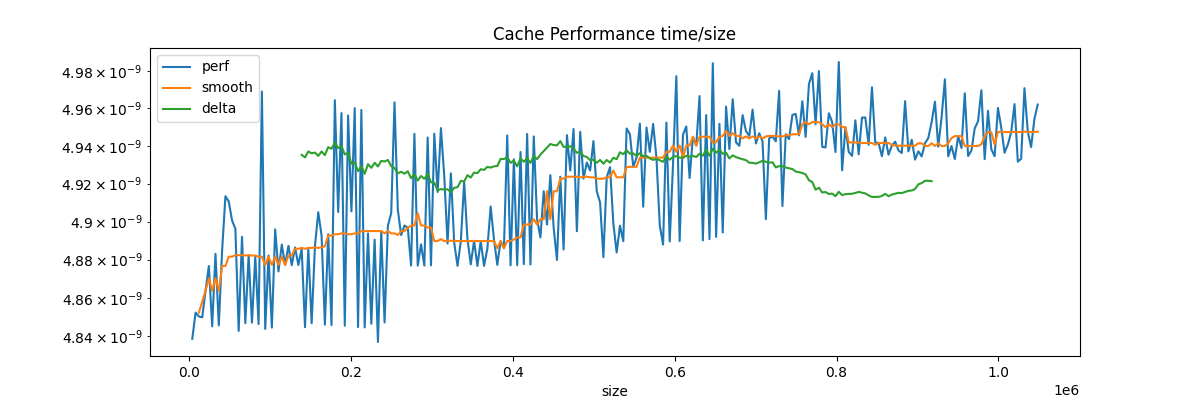
Cache Performance#
from tqdm import tqdm
import matplotlib.pyplot as plt
from pyquickhelper.loghelper import run_cmd
from pandas import DataFrame, concat
from onnx_extended.ext_test_case import unit_test_going
from onnx_extended.validation._validation import benchmark_cache, benchmark_cache_tree

obs = []
step = 2**12
for i in tqdm(range(step, 2**20 + step, step)):
    res = min(
        [
            benchmark_cache(i, False),
            benchmark_cache(i, False),
            benchmark_cache(i, False),
        ]
    )
    if res < 0:
        # overflow
        continue
    obs.append(dict(size=i, perf=res))

df = DataFrame(obs)
mean = df.perf.mean()
lag = 32
for i in range(2, df.shape[0]):
    df.loc[i, "smooth"] = df.loc[i - 8 : i + 8, "perf"].median()
    if i > lag and i < df.shape[0] - lag:
        df.loc[i, "delta"] = (
            mean
            + df.loc[i : i + lag, "perf"].mean()
            - df.loc[i - lag + 1 : i + 1, "perf"]
        ).mean()
  0%|          | 0/256 [00:00<?, ?it/s]
 22%|##1       | 56/256 [00:00<00:00, 559.57it/s]
 44%|####3     | 112/256 [00:00<00:00, 260.11it/s]
 57%|#####7    | 147/256 [00:00<00:00, 186.61it/s]
 67%|######7   | 172/256 [00:00<00:00, 151.03it/s]
 75%|#######4  | 191/256 [00:01<00:00, 129.29it/s]
 80%|########  | 206/256 [00:01<00:00, 114.43it/s]
 86%|########5 | 219/256 [00:01<00:00, 102.87it/s]
 90%|########9 | 230/256 [00:01<00:00, 93.96it/s]
 94%|#########3| 240/256 [00:01<00:00, 86.49it/s]
 97%|#########7| 249/256 [00:01<00:00, 80.41it/s]
100%|##########| 256/256 [00:02<00:00, 121.87it/s]
Cache size estimator#
cache_size_index = int(df.delta.argmax())
cache_size = df.loc[cache_size_index, "size"] * 2
print(f"L2 cache size estimation is {cache_size / 2 ** 20:1.3f} Mb.")
L2 cache size estimation is 0.875 Mb.
Verification#
try:
    out, err = run_cmd("lscpu", wait=True)
    print("\n".join(_ for _ in out.split("\n") if "cache:" in _))
except Exception as e:
    print(f"failed due to {e}")

df = df.set_index("size")
fig, ax = plt.subplots(1, 1, figsize=(12, 4))
df.plot(ax=ax, title="Cache Performance time/size", logy=True)
fig.savefig("plot_benchmark_cpu_array.png")
L1d cache:           24K
L1i cache:           32K
L2 cache:            1024K
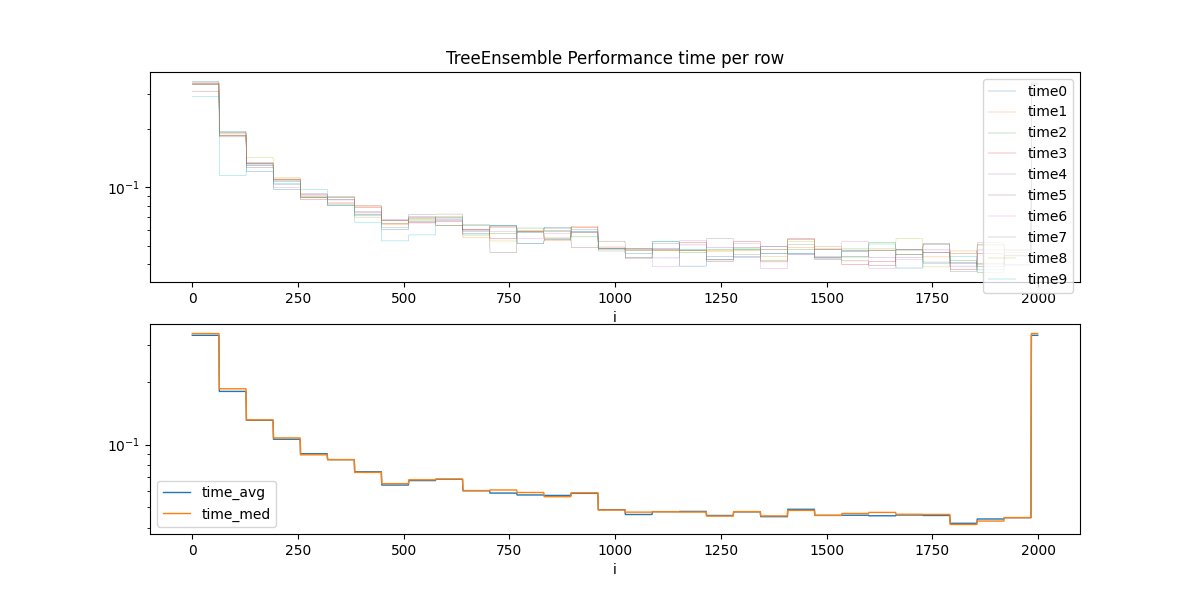
TreeEnsemble Performance#
We simulate the computation of a TreeEnsemble of 50 features, 100 trees and depth of 10 (so \(2^10\) nodes.)
dfs = []
cols = []
drop = []
for n in tqdm(range(10)):
    res = benchmark_cache_tree(
        n_rows=2000,
        n_features=50,
        n_trees=100,
        tree_size=1024,
        max_depth=10,
        search_step=64,
    )
    res = [[max(r.row, i), r.time] for i, r in enumerate(res)]
    df = DataFrame(res)
    df.columns = [f"i{n}", f"time{n}"]
    dfs.append(df)
    cols.append(df.columns[-1])
    drop.append(df.columns[0])
    if unit_test_going() and len(dfs) >= 3:
        break

df = concat(dfs, axis=1).reset_index(drop=True)
df["i"] = df["i0"]
df = df.drop(drop, axis=1)
df["time_avg"] = df[cols].mean(axis=1)
df["time_med"] = df[cols].median(axis=1)

df.head()
  0%|          | 0/10 [00:00<?, ?it/s]
 10%|#         | 1/10 [00:02<00:20,  2.25s/it]
 20%|##        | 2/10 [00:04<00:18,  2.28s/it]
 30%|###       | 3/10 [00:06<00:15,  2.28s/it]
 40%|####      | 4/10 [00:09<00:13,  2.27s/it]
 50%|#####     | 5/10 [00:11<00:11,  2.28s/it]
 60%|######    | 6/10 [00:13<00:09,  2.25s/it]
 70%|#######   | 7/10 [00:15<00:06,  2.26s/it]
 80%|########  | 8/10 [00:18<00:04,  2.27s/it]
 90%|######### | 9/10 [00:20<00:02,  2.29s/it]
100%|##########| 10/10 [00:22<00:00,  2.23s/it]
100%|##########| 10/10 [00:22<00:00,  2.26s/it]
Estimation#
Optimal batch size is among:
      i  time_med  time_avg
0  1792  0.041390  0.041916
1  1856  0.042975  0.043964
2  1920  0.044652  0.044593
3  1216  0.045406  0.045694
4  1344  0.045473  0.045114
5  1472  0.045798  0.045729
6  1728  0.046225  0.045711
7  1664  0.046305  0.045945
8  1536  0.046742  0.045827
9  1600  0.047283  0.045555
One possible estimation
Estimation: 1338.6245593695505
Plots.
cols_time = ["time_avg", "time_med"]
fig, ax = plt.subplots(2, 1, figsize=(12, 6))
df.set_index("i").drop(cols_time, axis=1).plot(
    ax=ax[0], title="TreeEnsemble Performance time per row", logy=True, linewidth=0.2
)
df.set_index("i")[cols_time].plot(ax=ax[1], linewidth=1.0, logy=True)
fig.savefig("plot_bench_cpu.png")
Total running time of the script: ( 0 minutes 30.762 seconds)