Note
Click here to download the full example code
Measuring CPU performance with a vector sum#
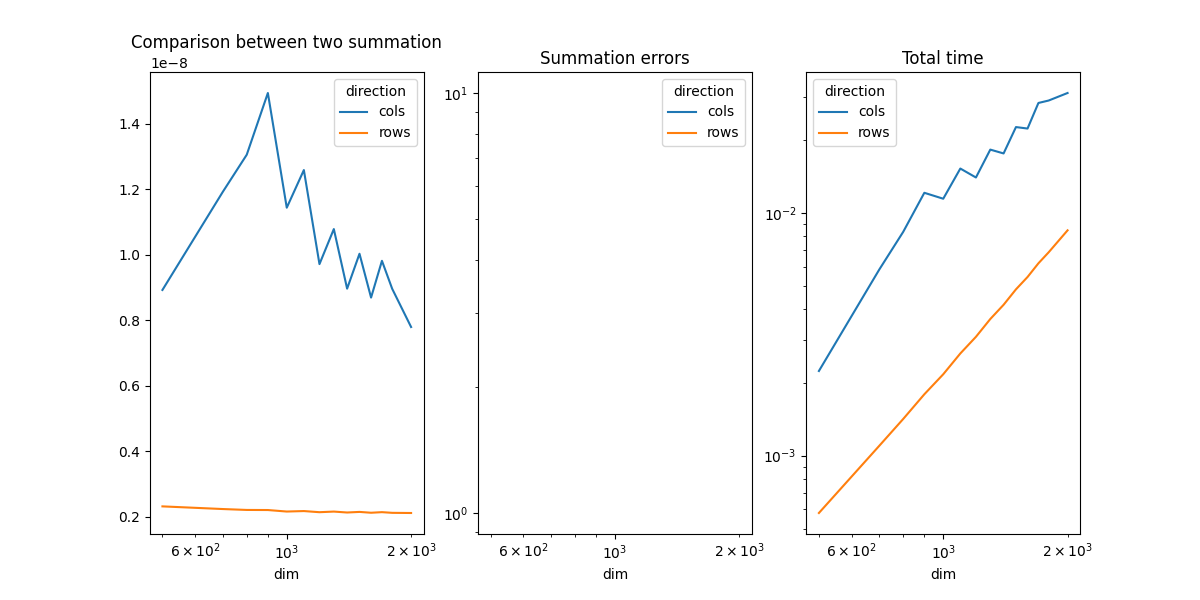
The example compares the time spend in computing the sum of all coefficients of a matrix when the function walks through the coefficients by rows or by columns.
Vector Sum#
from tqdm import tqdm
import numpy
import matplotlib.pyplot as plt
from pandas import DataFrame
from onnx_extended.ext_test_case import measure_time, unit_test_going
from onnx_extended.validation._validation import vector_sum_array as vector_sum

obs = []
dims = [500, 700, 800, 900, 1000, 1100, 1200, 1300, 1400, 1500, 1600, 1700, 1800, 2000]
if unit_test_going():
    dims = dims[:3]
for dim in tqdm(dims):
    values = numpy.ones((dim, dim), dtype=numpy.float32).ravel()
    diff = abs(vector_sum(dim, values, True) - dim**2)

    res = measure_time(lambda: vector_sum(dim, values, True), max_time=0.5)

    obs.append(
        dict(
            dim=dim,
            size=values.size,
            time=res["average"],
            direction="rows",
            time_per_element=res["average"] / dim**2,
            diff=diff,
        )
    )

    diff = abs(vector_sum(dim, values, False) - dim**2)
    res = measure_time(lambda: vector_sum(dim, values, False), max_time=0.5)

    obs.append(
        dict(
            dim=dim,
            size=values.size,
            time=res["average"],
            direction="cols",
            time_per_element=res["average"] / dim**2,
            diff=diff,
        )
    )


df = DataFrame(obs)
piv = df.pivot(index="dim", columns="direction", values="time_per_element")
print(piv)
  0%|          | 0/14 [00:00<?, ?it/s]
  7%|7         | 1/14 [00:01<00:15,  1.17s/it]
 14%|#4        | 2/14 [00:02<00:15,  1.26s/it]
 21%|##1       | 3/14 [00:03<00:14,  1.28s/it]
 29%|##8       | 4/14 [00:05<00:12,  1.28s/it]
 36%|###5      | 5/14 [00:06<00:11,  1.29s/it]
 43%|####2     | 6/14 [00:07<00:10,  1.29s/it]
 50%|#####     | 7/14 [00:08<00:08,  1.28s/it]
 57%|#####7    | 8/14 [00:10<00:07,  1.30s/it]
 64%|######4   | 9/14 [00:11<00:06,  1.30s/it]
 71%|#######1  | 10/14 [00:12<00:05,  1.30s/it]
 79%|#######8  | 11/14 [00:14<00:03,  1.29s/it]
 86%|########5 | 12/14 [00:15<00:02,  1.27s/it]
 93%|#########2| 13/14 [00:16<00:01,  1.27s/it]
100%|##########| 14/14 [00:17<00:00,  1.27s/it]
100%|##########| 14/14 [00:17<00:00,  1.28s/it]
direction          cols          rows
dim
500        8.922714e-09  2.319971e-09
700        1.191581e-08  2.238856e-09
800        1.304874e-08  2.211258e-09
900        1.493233e-08  2.208505e-09
1000       1.143300e-08  2.162595e-09
1100       1.258144e-08  2.177126e-09
1200       9.711618e-09  2.142436e-09
1300       1.078084e-08  2.161398e-09
1400       8.962978e-09  2.132981e-09
1500       1.002745e-08  2.151273e-09
1600       8.690569e-09  2.125626e-09
1700       9.811985e-09  2.143803e-09
1800       8.957913e-09  2.122980e-09
2000       7.792511e-09  2.118013e-09
Plots#
piv_diff = df.pivot(index="dim", columns="direction", values="diff")
piv_time = df.pivot(index="dim", columns="direction", values="time")

fig, ax = plt.subplots(1, 3, figsize=(12, 6))
piv.plot(ax=ax[0], logx=True, title="Comparison between two summation")
piv_diff.plot(ax=ax[1], logx=True, logy=True, title="Summation errors")
piv_time.plot(ax=ax[2], logx=True, logy=True, title="Total time")
fig.savefig("plot_bench_cpu_vector_sum.png")
/usr/local/lib/python3.9/site-packages/pandas/plotting/_matplotlib/core.py:744: UserWarning: Data has no positive values, and therefore cannot be log-scaled.
  labels = axis.get_majorticklabels() + axis.get_minorticklabels()
findfont: Font family ['STIXGeneral'] not found. Falling back to DejaVu Sans.
findfont: Font family ['STIXGeneral'] not found. Falling back to DejaVu Sans.
findfont: Font family ['STIXGeneral'] not found. Falling back to DejaVu Sans.
findfont: Font family ['STIXNonUnicode'] not found. Falling back to DejaVu Sans.
findfont: Font family ['STIXNonUnicode'] not found. Falling back to DejaVu Sans.
findfont: Font family ['STIXNonUnicode'] not found. Falling back to DejaVu Sans.
findfont: Font family ['STIXSizeOneSym'] not found. Falling back to DejaVu Sans.
findfont: Font family ['STIXSizeTwoSym'] not found. Falling back to DejaVu Sans.
findfont: Font family ['STIXSizeThreeSym'] not found. Falling back to DejaVu Sans.
findfont: Font family ['STIXSizeFourSym'] not found. Falling back to DejaVu Sans.
findfont: Font family ['STIXSizeFiveSym'] not found. Falling back to DejaVu Sans.
findfont: Font family ['cmsy10'] not found. Falling back to DejaVu Sans.
findfont: Font family ['cmr10'] not found. Falling back to DejaVu Sans.
findfont: Font family ['cmtt10'] not found. Falling back to DejaVu Sans.
findfont: Font family ['cmmi10'] not found. Falling back to DejaVu Sans.
findfont: Font family ['cmb10'] not found. Falling back to DejaVu Sans.
findfont: Font family ['cmss10'] not found. Falling back to DejaVu Sans.
findfont: Font family ['cmex10'] not found. Falling back to DejaVu Sans.
findfont: Font family ['DejaVu Sans Display'] not found. Falling back to DejaVu Sans.
The summation by rows is much faster as expected. That explains why it is usually more efficient to transpose the first matrix before a matrix multiplication.
Total running time of the script: ( 0 minutes 24.434 seconds)