Note
Click here to download the full example code
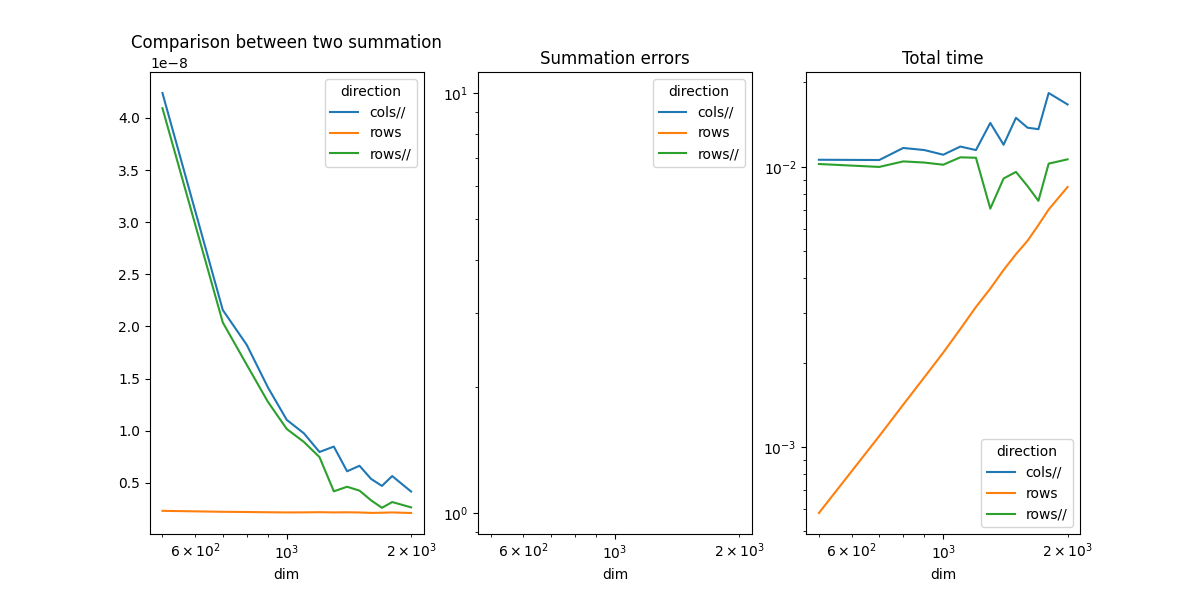
Measuring CPU performance with a parallelized vector sum#
The example compares the time spend in computing the sum of all coefficients of a matrix when the function walks through the coefficients by rows or by columns when the computation is parallelized.
Vector Sum#
from tqdm import tqdm
import numpy
import matplotlib.pyplot as plt
from pandas import DataFrame
from onnx_extended.ext_test_case import measure_time, unit_test_going
from onnx_extended.validation._validation import (
    vector_sum_array as vector_sum,
    vector_sum_array_parallel as vector_sum_parallel,
)

obs = []
dims = [500, 700, 800, 900, 1000, 1100, 1200, 1300, 1400, 1500, 1600, 1700, 1800, 2000]
if unit_test_going():
    dims = dims[:3]
for dim in tqdm(dims):
    values = numpy.ones((dim, dim), dtype=numpy.float32).ravel()
    diff = abs(vector_sum(dim, values, True) - dim**2)

    res = measure_time(lambda: vector_sum(dim, values, True), max_time=0.5)

    obs.append(
        dict(
            dim=dim,
            size=values.size,
            time=res["average"],
            direction="rows",
            time_per_element=res["average"] / dim**2,
            diff=diff,
        )
    )

    res = measure_time(lambda: vector_sum_parallel(dim, values, True), max_time=0.5)

    obs.append(
        dict(
            dim=dim,
            size=values.size,
            time=res["average"],
            direction="rows//",
            time_per_element=res["average"] / dim**2,
            diff=diff,
        )
    )

    diff = abs(vector_sum(dim, values, False) - dim**2)
    res = measure_time(lambda: vector_sum_parallel(dim, values, False), max_time=0.5)

    obs.append(
        dict(
            dim=dim,
            size=values.size,
            time=res["average"],
            direction="cols//",
            time_per_element=res["average"] / dim**2,
            diff=diff,
        )
    )


df = DataFrame(obs)
piv = df.pivot(index="dim", columns="direction", values="time_per_element")
print(piv)
  0%|          | 0/14 [00:00<?, ?it/s]
  7%|7         | 1/14 [00:01<00:22,  1.72s/it]
 14%|#4        | 2/14 [00:03<00:20,  1.72s/it]
 21%|##1       | 3/14 [00:05<00:19,  1.74s/it]
 29%|##8       | 4/14 [00:07<00:17,  1.78s/it]
 36%|###5      | 5/14 [00:08<00:16,  1.83s/it]
 43%|####2     | 6/14 [00:10<00:14,  1.85s/it]
 50%|#####     | 7/14 [00:12<00:12,  1.82s/it]
 57%|#####7    | 8/14 [00:14<00:10,  1.81s/it]
 64%|######4   | 9/14 [00:16<00:09,  1.84s/it]
 71%|#######1  | 10/14 [00:18<00:07,  1.87s/it]
 79%|#######8  | 11/14 [00:20<00:05,  1.87s/it]
 86%|########5 | 12/14 [00:22<00:03,  1.90s/it]
 93%|#########2| 13/14 [00:24<00:01,  1.93s/it]
100%|##########| 14/14 [00:26<00:00,  1.94s/it]
100%|##########| 14/14 [00:26<00:00,  1.86s/it]
direction        cols//          rows        rows//
dim
500        4.238436e-08  2.325730e-09  4.092764e-08
700        2.157749e-08  2.232951e-09  2.038646e-08
800        1.823866e-08  2.212191e-09  1.633296e-08
900        1.416694e-08  2.189656e-09  1.278406e-08
1000       1.104241e-08  2.171995e-09  1.017222e-08
1100       9.759492e-09  2.179661e-09  8.933916e-09
1200       7.967947e-09  2.194684e-09  7.480013e-09
1300       8.483947e-09  2.175047e-09  4.195949e-09
1400       6.115952e-09  2.185732e-09  4.635022e-09
1500       6.646210e-09  2.167680e-09  4.261122e-09
1600       5.386631e-09  2.127125e-09  3.333226e-09
1700       4.713320e-09  2.144145e-09  2.616001e-09
1800       5.660132e-09  2.172713e-09  3.167737e-09
2000       4.173346e-09  2.117624e-09  2.657948e-09
Plots#
piv_diff = df.pivot(index="dim", columns="direction", values="diff")
piv_time = df.pivot(index="dim", columns="direction", values="time")

fig, ax = plt.subplots(1, 3, figsize=(12, 6))
piv.plot(ax=ax[0], logx=True, title="Comparison between two summation")
piv_diff.plot(ax=ax[1], logx=True, logy=True, title="Summation errors")
piv_time.plot(ax=ax[2], logx=True, logy=True, title="Total time")
fig.savefig("plot_bench_cpu_vector_sum_parallel.png")
/usr/local/lib/python3.9/site-packages/pandas/plotting/_matplotlib/core.py:744: UserWarning: Data has no positive values, and therefore cannot be log-scaled.
  labels = axis.get_majorticklabels() + axis.get_minorticklabels()
The summation by rows is much faster as expected. That explains why it is usually more efficient to transpose the first matrix before a matrix multiplication. Parallelization is faster.
Total running time of the script: ( 0 minutes 31.100 seconds)