Note
Click here to download the full example code
Compares numpy to onnxruntime on simple functions#
onnxruntime can be used a replacement to numpy.
It can be used to implement a training algorithm,
onnxruntime-training differentiate an onnx graph and
runs it to compute the gradient. Simple functions are implemented
in ONNX and ran with onnxruntime to update the weights.
function_onnx_graph returns many
functions used to implement a training algorithm.
The following benchmarks compares a couple of implementations:
numpy: an implementation based on numpy, not optimized
sess: inference through an ONNX graph executed with method onnxruntime.InferenceSession.run
bind: inference through an ONNX graph executed with method onnxruntime.InferenceSession.run_with_iobinding
inplace: inference through an ONNX graph executed with method onnxruntime.InferenceSession.run_with_iobinding but without counting the binding assuming input buffers are reused and do not need binding again
axpy#
This function implements  .
.
import numpy
from scipy.special import expit
import pandas
from tqdm import tqdm
from cpyquickhelper.numbers.speed_measure import measure_time
import matplotlib.pyplot as plt
from onnxruntime import InferenceSession
from onnxruntime.capi._pybind_state import (  # pylint: disable=E0611
    SessionIOBinding, OrtDevice as C_OrtDevice,
    OrtValue as C_OrtValue)
from mlprodict.plotting.text_plot import onnx_simple_text_plot
from onnxcustom.utils.onnx_function import function_onnx_graph

fct_onx = function_onnx_graph("axpy")
print(onnx_simple_text_plot(fct_onx))
opset: domain='' version=14
input: name='X1' type=dtype('float32') shape=None
input: name='X2' type=dtype('float32') shape=None
input: name='alpha' type=dtype('float32') shape=[1]
Mul(X1, alpha) -> Mu_C0
  Add(Mu_C0, X2) -> Y
output: name='Y' type=dtype('float32') shape=None
The numpy implementation is the following.
fct_numpy = lambda X1, X2, alpha: X1 * alpha + X2
The benchmark
def reshape(a, dim):
    if len(a.shape) == 2:
        return a[:dim].copy()
    return a


def bind_and_run(sess, bind, names, args, out_names, device):
    for n, a in zip(names, args):
        bind.bind_ortvalue_input(n, a)
    for o in out_names:
        bind.bind_output(o, device)
    sess.run_with_iobinding(bind, None)
    return bind.get_outputs()


def nobind_just_run(sess, bind):
    sess.run_with_iobinding(bind, None)


def benchmark(name, onx, fct_numpy, *args,
              dims=(1, 10, 100, 200, 500, 1000, 2000, 10000)):
    sess = InferenceSession(onx.SerializeToString())
    device = C_OrtDevice(
        C_OrtDevice.cpu(), C_OrtDevice.default_memory(), 0)
    names = [i.name for i in sess.get_inputs()]
    out_names = [o.name for o in sess.get_outputs()]
    if len(names) != len(args):
        raise RuntimeError(
            f"Size mismatch {len(names)} != {len(args)}.")

    rows = []
    for dim in tqdm(dims):
        new_args = [reshape(a, dim) for a in args]
        ortvalues = [
            C_OrtValue.ortvalue_from_numpy(a, device)
            for a in new_args]

        ms = measure_time(lambda: fct_numpy(*new_args),
                          repeat=50, number=100)
        ms.update(dict(name=name, impl='numpy', dim=dim))
        rows.append(ms)

        inps = {n: a for n, a in zip(names, new_args)}
        ms = measure_time(lambda: sess.run(None, inps))
        ms.update(dict(name=name, impl='sess', dim=dim))
        rows.append(ms)

        bind = SessionIOBinding(sess._sess)
        ms = measure_time(
            lambda: bind_and_run(
                sess._sess, bind, names, ortvalues, out_names, device))
        ms.update(dict(name=name, impl='bind_run', dim=dim))
        rows.append(ms)

        ms = measure_time(
            lambda: nobind_just_run(sess._sess, bind))
        ms.update(dict(name=name, impl='inplace', dim=dim))
        rows.append(ms)

    return rows
Back to function axpy.
rows = benchmark(
    'axpy', fct_onx, fct_numpy,
    numpy.random.randn(1000, 10).astype(numpy.float32),
    numpy.random.randn(1000, 10).astype(numpy.float32),
    numpy.array([0.5], dtype=numpy.float32))

all_rows = []
all_rows.extend(rows)
piv = pandas.DataFrame(rows).pivot('dim', 'impl', 'average')
piv
  0%|          | 0/8 [00:00<?, ?it/s]
 12%|#2        | 1/8 [00:00<00:01,  6.21it/s]
 25%|##5       | 2/8 [00:00<00:00,  6.12it/s]
 38%|###7      | 3/8 [00:00<00:00,  5.65it/s]
 50%|#####     | 4/8 [00:00<00:00,  5.37it/s]
 62%|######2   | 5/8 [00:00<00:00,  4.99it/s]
 75%|#######5  | 6/8 [00:01<00:00,  4.48it/s]
 88%|########7 | 7/8 [00:01<00:00,  4.22it/s]
100%|##########| 8/8 [00:01<00:00,  4.06it/s]
100%|##########| 8/8 [00:01<00:00,  4.59it/s]
Graph.
name = rows[0]['name']
ax = piv.plot(logx=True, logy=True)
ax.set_title(name + "\nlower is better")
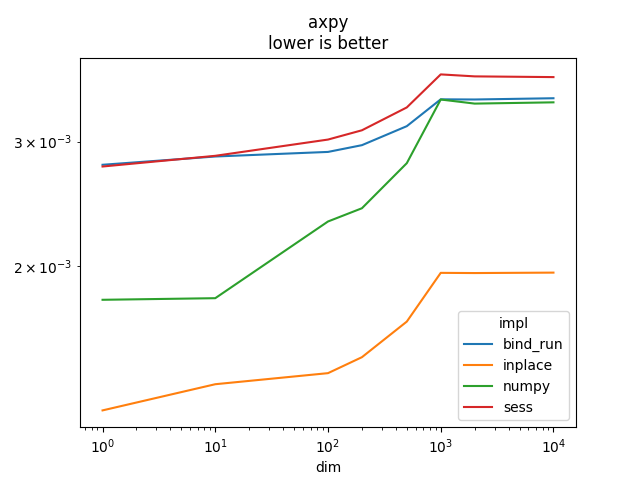
Text(0.5, 1.0, 'axpy\nlower is better')
axpyw#
It does  where
where  and
and
 .
.
fct_onx = function_onnx_graph("axpyw")
print(onnx_simple_text_plot(fct_onx))
opset: domain='' version=14
input: name='X1' type=dtype('float32') shape=None
input: name='X2' type=dtype('float32') shape=None
input: name='G' type=dtype('float32') shape=None
input: name='alpha' type=dtype('float32') shape=[1]
input: name='beta' type=dtype('float32') shape=[1]
Mul(X1, alpha) -> Mu_C0
Mul(G, beta) -> Mu_C02
  Add(Mu_C0, Mu_C02) -> Z
    Add(Z, X2) -> Y
output: name='Y' type=dtype('float32') shape=None
output: name='Z' type=dtype('float32') shape=None
benchmark
fct_numpy = lambda x1, x2, g, alpha, beta: (
    x1 * alpha + x2 + beta * g, x1 * alpha + beta * g)

rows = benchmark(
    'axpyw', fct_onx, fct_numpy,
    numpy.random.randn(1000, 10).astype(numpy.float32),
    numpy.random.randn(1000, 10).astype(numpy.float32),
    numpy.random.randn(1000, 10).astype(numpy.float32),
    numpy.array([0.5], dtype=numpy.float32),
    numpy.array([0.5], dtype=numpy.float32))

all_rows.extend(rows)
piv = pandas.DataFrame(rows).pivot('dim', 'impl', 'average')
piv
  0%|          | 0/8 [00:00<?, ?it/s]
 12%|#2        | 1/8 [00:00<00:02,  2.62it/s]
 25%|##5       | 2/8 [00:00<00:02,  2.62it/s]
 38%|###7      | 3/8 [00:01<00:02,  2.37it/s]
 50%|#####     | 4/8 [00:01<00:01,  2.21it/s]
 62%|######2   | 5/8 [00:02<00:01,  2.00it/s]
 75%|#######5  | 6/8 [00:03<00:01,  1.76it/s]
 88%|########7 | 7/8 [00:03<00:00,  1.59it/s]
100%|##########| 8/8 [00:04<00:00,  1.49it/s]
100%|##########| 8/8 [00:04<00:00,  1.77it/s]
Graph.
name = rows[0]['name']
ax = piv.plot(logx=True, logy=True)
ax.set_title(name + "\nlower is better")
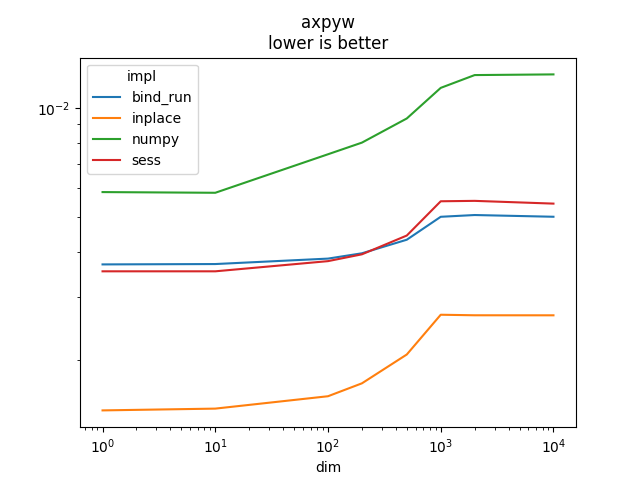
Text(0.5, 1.0, 'axpyw\nlower is better')
axpyw2#
It implements
where and
 .
.
fct_onx = function_onnx_graph("axpyw2")
print(onnx_simple_text_plot(fct_onx))
opset: domain='' version=14
input: name='X1' type=dtype('float32') shape=None
input: name='X2' type=dtype('float32') shape=None
input: name='G' type=dtype('float32') shape=None
input: name='alpha' type=dtype('float32') shape=[1]
input: name='beta' type=dtype('float32') shape=[1]
Mul(X1, alpha) -> Mu_C0
Mul(G, beta) -> Mu_C03
  Add(Mu_C0, Mu_C03) -> Z
    Mul(Z, beta) -> Mu_C02
  Add(Mu_C0, Mu_C02) -> Ad_C0
    Add(Ad_C0, X2) -> Y
output: name='Y' type=dtype('float32') shape=None
output: name='Z' type=dtype('float32') shape=None
benchmark
fct_numpy = lambda x1, x2, g, alpha, beta: (
    x1 * alpha + x2 + beta * (x1 * alpha + beta * g),
    x1 * alpha + beta * g)

rows = benchmark(
    'axpyw2', fct_onx, fct_numpy,
    numpy.random.randn(1000, 10).astype(numpy.float32),
    numpy.random.randn(1000, 10).astype(numpy.float32),
    numpy.random.randn(1000, 10).astype(numpy.float32),
    numpy.array([0.5], dtype=numpy.float32),
    numpy.array([0.5], dtype=numpy.float32))

all_rows.extend(rows)
piv = pandas.DataFrame(rows).pivot('dim', 'impl', 'average')
piv
  0%|          | 0/8 [00:00<?, ?it/s]
 12%|#2        | 1/8 [00:00<00:03,  1.94it/s]
 25%|##5       | 2/8 [00:01<00:03,  1.94it/s]
 38%|###7      | 3/8 [00:01<00:02,  1.73it/s]
 50%|#####     | 4/8 [00:02<00:02,  1.62it/s]
 62%|######2   | 5/8 [00:03<00:02,  1.46it/s]
 75%|#######5  | 6/8 [00:04<00:01,  1.27it/s]
 88%|########7 | 7/8 [00:05<00:00,  1.17it/s]
100%|##########| 8/8 [00:06<00:00,  1.11it/s]
100%|##########| 8/8 [00:06<00:00,  1.30it/s]
copy#
It implements a copy.
fct_onx = function_onnx_graph("copy")
print(onnx_simple_text_plot(fct_onx))
opset: domain='' version=15
input: name='X' type=dtype('float32') shape=None
Identity(X) -> Y
output: name='Y' type=dtype('float32') shape=None
benchmark
fct_numpy = lambda x: x.copy()

rows = benchmark(
    'copy', fct_onx, fct_numpy,
    numpy.random.randn(1000, 10).astype(numpy.float32))

all_rows.extend(rows)
piv = pandas.DataFrame(rows).pivot('dim', 'impl', 'average')
piv
  0%|          | 0/8 [00:00<?, ?it/s]
 25%|##5       | 2/8 [00:00<00:00, 13.88it/s]
 50%|#####     | 4/8 [00:00<00:00, 12.85it/s]
 75%|#######5  | 6/8 [00:00<00:00, 11.59it/s]
100%|##########| 8/8 [00:00<00:00, 10.88it/s]
100%|##########| 8/8 [00:00<00:00, 11.39it/s]
Graph.
name = rows[0]['name']
ax = piv.plot(logx=True, logy=True)
ax.set_title(name + "\nlower is better")
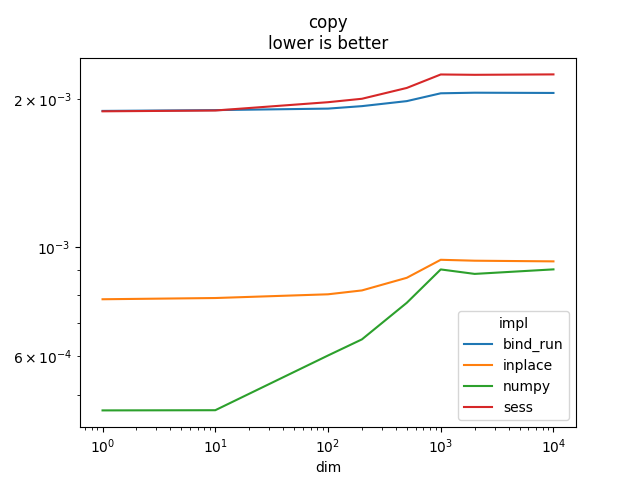
Text(0.5, 1.0, 'copy\nlower is better')
grad_loss_absolute_error#
It implements  .
.
fct_onx = function_onnx_graph("grad_loss_absolute_error")
print(onnx_simple_text_plot(fct_onx))
opset: domain='' version=14
input: name='X1' type=dtype('float32') shape=[None, None]
input: name='X2' type=dtype('float32') shape=[None, None]
init: name='Re_Reshapecst' type=dtype('int64') shape=(1,) -- array([-1])
Sub(X1, X2) -> Su_C0
  Abs(Su_C0) -> Ab_Y0
    ReduceSum(Ab_Y0) -> Re_reduced0
      Reshape(Re_reduced0, Re_Reshapecst) -> Y
  Sign(Su_C0) -> Y_grad
output: name='Y' type=dtype('float32') shape=None
output: name='Y_grad' type=dtype('float32') shape=None
benchmark
fct_numpy = lambda x1, x2: (
    numpy.abs(x1 - x2).sum(), numpy.sign(x1 - x2))

rows = benchmark(
    'grad_loss_absolute_error', fct_onx, fct_numpy,
    numpy.random.randn(1000, 10).astype(numpy.float32),
    numpy.random.randn(1000, 10).astype(numpy.float32))

all_rows.extend(rows)
piv = pandas.DataFrame(rows).pivot('dim', 'impl', 'average')
piv
  0%|          | 0/8 [00:00<?, ?it/s]
 12%|#2        | 1/8 [00:00<00:01,  3.57it/s]
 25%|##5       | 2/8 [00:00<00:01,  3.55it/s]
 38%|###7      | 3/8 [00:00<00:01,  3.15it/s]
 50%|#####     | 4/8 [00:01<00:01,  2.85it/s]
 62%|######2   | 5/8 [00:01<00:01,  2.41it/s]
 75%|#######5  | 6/8 [00:02<00:01,  1.93it/s]
 88%|########7 | 7/8 [00:03<00:00,  1.72it/s]
100%|##########| 8/8 [00:04<00:00,  1.60it/s]
100%|##########| 8/8 [00:04<00:00,  2.00it/s]
Graph.
name = rows[0]['name']
ax = piv.plot(logx=True, logy=True)
ax.set_title(name + "\nlower is better")
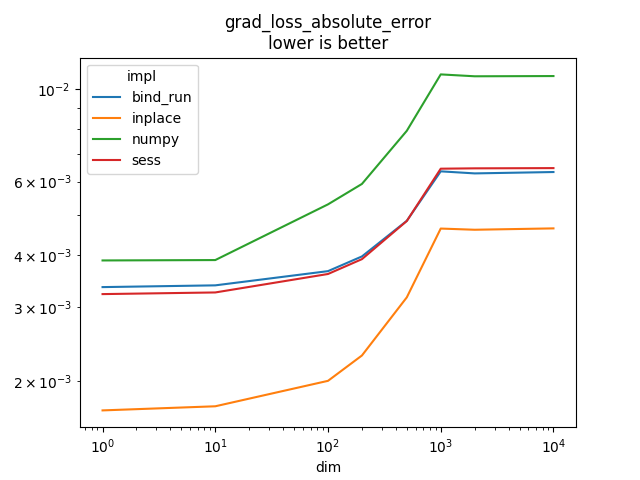
Text(0.5, 1.0, 'grad_loss_absolute_error\nlower is better')
grad_loss_square_error#
It implements  .
.
fct_onx = function_onnx_graph("grad_loss_square_error")
print(onnx_simple_text_plot(fct_onx))
opset: domain='' version=15
input: name='X1' type=dtype('float32') shape=[None, None]
input: name='X2' type=dtype('float32') shape=[None, None]
init: name='Mu_Mulcst' type=dtype('float32') shape=(1,) -- array([1.], dtype=float32)
init: name='Re_Reshapecst' type=dtype('int64') shape=(1,) -- array([-1])
init: name='Mu_Mulcst1' type=dtype('float32') shape=(1,) -- array([-2.], dtype=float32)
Sub(X1, X2) -> Su_C0
  ReduceSumSquare(Su_C0) -> Re_reduced0
    Mul(Re_reduced0, Mu_Mulcst) -> Mu_C0
      Reshape(Mu_C0, Re_Reshapecst) -> Y
  Mul(Su_C0, Mu_Mulcst1) -> Y_grad
output: name='Y' type=dtype('float32') shape=None
output: name='Y_grad' type=dtype('float32') shape=None
benchmark
fct_numpy = lambda x1, x2: (
    ((x1 - x2) ** 2).sum(), (x1 - x2) * (-2))

rows = benchmark(
    'grad_loss_square_error', fct_onx, fct_numpy,
    numpy.random.randn(1000, 10).astype(numpy.float32),
    numpy.random.randn(1000, 10).astype(numpy.float32))

all_rows.extend(rows)
piv = pandas.DataFrame(rows).pivot('dim', 'impl', 'average')
piv
  0%|          | 0/8 [00:00<?, ?it/s]
 12%|#2        | 1/8 [00:00<00:02,  3.08it/s]
 25%|##5       | 2/8 [00:00<00:01,  3.07it/s]
 38%|###7      | 3/8 [00:01<00:01,  2.82it/s]
 50%|#####     | 4/8 [00:01<00:01,  2.67it/s]
 62%|######2   | 5/8 [00:01<00:01,  2.45it/s]
 75%|#######5  | 6/8 [00:02<00:00,  2.19it/s]
 88%|########7 | 7/8 [00:03<00:00,  2.06it/s]
100%|##########| 8/8 [00:03<00:00,  1.98it/s]
100%|##########| 8/8 [00:03<00:00,  2.25it/s]
Graph.
name = rows[0]['name']
ax = piv.plot(logx=True, logy=True)
ax.set_title(name + "\nlower is better")
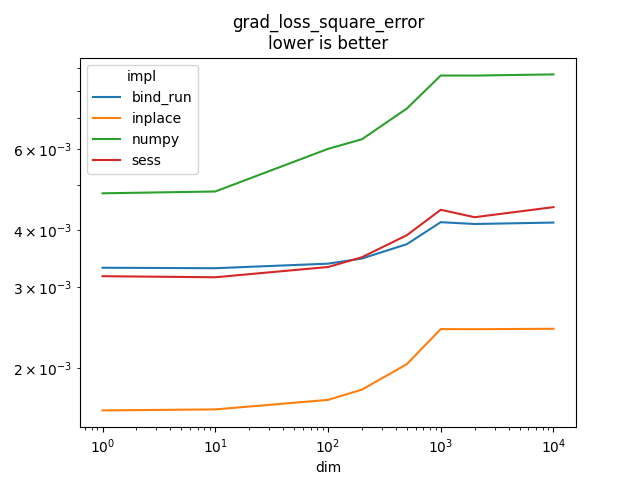
Text(0.5, 1.0, 'grad_loss_square_error\nlower is better')
grad_loss_elastic_error#
It implements  or
or
 if
weight_name is not None and its gradient.
l1_weight is
if
weight_name is not None and its gradient.
l1_weight is  and
l2_weight is
and
l2_weight is  .
.
fct_onx = function_onnx_graph("grad_loss_elastic_error")
print(onnx_simple_text_plot(fct_onx))
opset: domain='' version=15
input: name='X1' type=dtype('float32') shape=[None, None]
input: name='X2' type=dtype('float32') shape=[None, None]
init: name='Mu_Mulcst' type=dtype('float32') shape=(1,) -- array([0.01], dtype=float32)
init: name='Re_Reshapecst' type=dtype('int64') shape=(1,) -- array([-1])
init: name='Mu_Mulcst3' type=dtype('float32') shape=(1,) -- array([-0.02], dtype=float32)
Identity(Mu_Mulcst) -> Mu_Mulcst1
Sub(X1, X2) -> Su_C0
  Abs(Su_C0) -> Ab_Y0
    Mul(Ab_Y0, Mu_Mulcst) -> Mu_C0
Identity(Mu_Mulcst) -> Mu_Mulcst2
Mul(Su_C0, Mu_Mulcst3) -> Mu_C05
Sign(Su_C0) -> Si_output0
  Mul(Si_output0, Mu_Mulcst2) -> Mu_C04
  Add(Mu_C04, Mu_C05) -> Ad_C02
    Identity(Ad_C02) -> Y_grad
  Mul(Su_C0, Su_C0) -> Mu_C03
  Mul(Mu_C03, Mu_Mulcst1) -> Mu_C02
    Add(Mu_C0, Mu_C02) -> Ad_C0
      ReduceSum(Ad_C0) -> Re_reduced0
        Reshape(Re_reduced0, Re_Reshapecst) -> Y
output: name='Y' type=dtype('float32') shape=None
output: name='Y_grad' type=dtype('float32') shape=None
benchmark
fct_numpy = lambda x1, x2: (
    numpy.abs(x1 - x2).sum() * 0.1 + ((x1 - x2) ** 2).sum() * 0.9,
    numpy.sign(x1 - x2) * 0.1 - 2 * 0.9 * (x1 - x2))

rows = benchmark(
    'grad_loss_elastic_error', fct_onx, fct_numpy,
    numpy.random.randn(1000, 10).astype(numpy.float32),
    numpy.random.randn(1000, 10).astype(numpy.float32))

all_rows.extend(rows)
piv = pandas.DataFrame(rows).pivot('dim', 'impl', 'average')
piv
  0%|          | 0/8 [00:00<?, ?it/s]
 12%|#2        | 1/8 [00:00<00:05,  1.32it/s]
 25%|##5       | 2/8 [00:01<00:04,  1.32it/s]
 38%|###7      | 3/8 [00:02<00:04,  1.19it/s]
 50%|#####     | 4/8 [00:03<00:03,  1.10it/s]
 62%|######2   | 5/8 [00:04<00:03,  1.02s/it]
 75%|#######5  | 6/8 [00:06<00:02,  1.20s/it]
 88%|########7 | 7/8 [00:07<00:01,  1.31s/it]
100%|##########| 8/8 [00:09<00:00,  1.38s/it]
100%|##########| 8/8 [00:09<00:00,  1.16s/it]
Graph.
name = rows[0]['name']
ax = piv.plot(logx=True, logy=True)
ax.set_title(name + "\nlower is better")
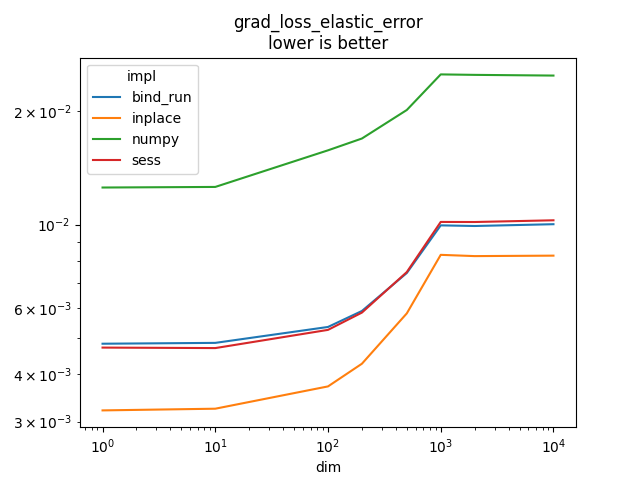
Text(0.5, 1.0, 'grad_loss_elastic_error\nlower is better')
n_penalty_elastic_error#
It implements  l1_weight is and
l2_weight is .
It does that for n_tensors and adds all of the results
to an input loss.
l1_weight is and
l2_weight is .
It does that for n_tensors and adds all of the results
to an input loss.
fct_onx = function_onnx_graph("n_penalty_elastic_error")
print(onnx_simple_text_plot(fct_onx))
opset: domain='' version=15
input: name='loss' type=dtype('float32') shape=[1, 1]
input: name='W0' type=dtype('float32') shape=None
init: name='Mu_Mulcst' type=dtype('float32') shape=(1,) -- array([0.01], dtype=float32)
init: name='Re_Reshapecst' type=dtype('int64') shape=(1,) -- array([-1])
Abs(W0) -> Ab_Y0
  ReduceSum(Ab_Y0) -> Re_reduced0
    Mul(Re_reduced0, Mu_Mulcst) -> Mu_C0
ReduceSumSquare(W0) -> Re_reduced02
Identity(Mu_Mulcst) -> Mu_Mulcst1
  Mul(Re_reduced02, Mu_Mulcst1) -> Mu_C02
    Add(Mu_C0, Mu_C02) -> Ad_C01
      Add(loss, Ad_C01) -> Ad_C0
        Reshape(Ad_C0, Re_Reshapecst) -> Y
output: name='Y' type=dtype('float32') shape=[None]
benchmark
fct_numpy = lambda loss, x: numpy.abs(x).sum() * 0.1 + ((x) ** 2).sum() * 0.9

rows = benchmark(
    'n_penalty_elastic_error', fct_onx, fct_numpy,
    numpy.array([[0.5]], dtype=numpy.float32),
    numpy.random.randn(1000, 10).astype(numpy.float32))

all_rows.extend(rows)
piv = pandas.DataFrame(rows).pivot('dim', 'impl', 'average')
piv
  0%|          | 0/8 [00:00<?, ?it/s]
 12%|#2        | 1/8 [00:00<00:03,  2.25it/s]
 25%|##5       | 2/8 [00:00<00:02,  2.24it/s]
 38%|###7      | 3/8 [00:01<00:02,  2.13it/s]
 50%|#####     | 4/8 [00:01<00:01,  2.06it/s]
 62%|######2   | 5/8 [00:02<00:01,  1.97it/s]
 75%|#######5  | 6/8 [00:03<00:01,  1.83it/s]
 88%|########7 | 7/8 [00:03<00:00,  1.76it/s]
100%|##########| 8/8 [00:04<00:00,  1.71it/s]
100%|##########| 8/8 [00:04<00:00,  1.86it/s]
Graph.
name = rows[0]['name']
ax = piv.plot(logx=True, logy=True)
ax.set_title(name + "\nlower is better")
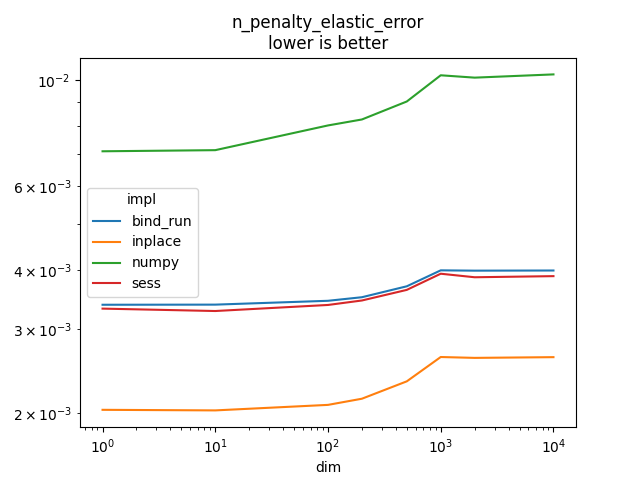
Text(0.5, 1.0, 'n_penalty_elastic_error\nlower is better')
update_penalty_elastic_error#
It implements  l1 is and
l2 is .
l1 is and
l2 is .
fct_onx = function_onnx_graph("update_penalty_elastic_error")
print(onnx_simple_text_plot(fct_onx))
opset: domain='' version=14
input: name='X' type=dtype('float32') shape=None
init: name='Mu_Mulcst' type=dtype('float32') shape=(1,) -- array([0.9998], dtype=float32)
init: name='Mu_Mulcst1' type=dtype('float32') shape=(1,) -- array([1.e-04], dtype=float32)
Mul(X, Mu_Mulcst) -> Mu_C0
Sign(X) -> Si_output0
  Mul(Si_output0, Mu_Mulcst1) -> Mu_C02
  Sub(Mu_C0, Mu_C02) -> Y
output: name='Y' type=dtype('float32') shape=None
benchmark
fct_numpy = lambda x: numpy.sign(x) * 0.1 + (x * 0.9 * 2)

rows = benchmark(
    'update_penalty_elastic_error', fct_onx, fct_numpy,
    numpy.random.randn(1000, 10).astype(numpy.float32))

all_rows.extend(rows)
piv = pandas.DataFrame(rows).pivot('dim', 'impl', 'average')
piv
  0%|          | 0/8 [00:00<?, ?it/s]
 12%|#2        | 1/8 [00:00<00:02,  3.19it/s]
 25%|##5       | 2/8 [00:00<00:01,  3.17it/s]
 38%|###7      | 3/8 [00:01<00:01,  2.81it/s]
 50%|#####     | 4/8 [00:01<00:01,  2.56it/s]
 62%|######2   | 5/8 [00:02<00:01,  2.19it/s]
 75%|#######5  | 6/8 [00:02<00:01,  1.78it/s]
 88%|########7 | 7/8 [00:03<00:00,  1.59it/s]
100%|##########| 8/8 [00:04<00:00,  1.49it/s]
100%|##########| 8/8 [00:04<00:00,  1.84it/s]
Graph.
name = rows[0]['name']
ax = piv.plot(logx=True, logy=True)
ax.set_title(name + "\nlower is better")
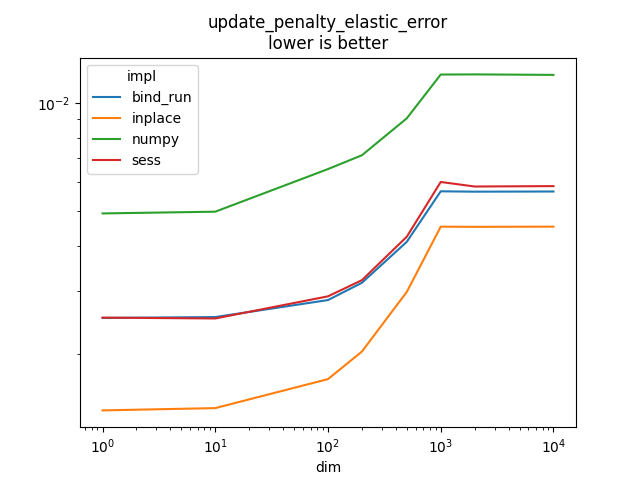
Text(0.5, 1.0, 'update_penalty_elastic_error\nlower is better')
grad_sigmoid_neg_log_loss_error#
See _onnx_grad_sigmoid_neg_log_loss_error.
fct_onx = function_onnx_graph("grad_sigmoid_neg_log_loss_error")
print(onnx_simple_text_plot(fct_onx))
opset: domain='' version=15
input: name='X1' type=dtype('int64') shape=[None, None]
input: name='X2' type=dtype('float32') shape=[None, None]
init: name='Su_Subcst' type=dtype('float32') shape=(1,) -- array([1.], dtype=float32)
init: name='Cl_Clipcst' type=dtype('float32') shape=(1,) -- array([1.e-05], dtype=float32)
init: name='Cl_Clipcst1' type=dtype('float32') shape=(1,) -- array([0.99999], dtype=float32)
init: name='Re_Reshapecst' type=dtype('int64') shape=(1,) -- array([-1])
Cast(X1, to=1) -> Ca_output0
  Sub(Su_Subcst, Ca_output0) -> Su_C0
Identity(Su_Subcst) -> Su_Subcst1
Sigmoid(X2) -> Si_Y0
  Clip(Si_Y0, Cl_Clipcst, Cl_Clipcst1) -> Cl_output0
  Sub(Cl_output0, Ca_output0) -> Y_grad
Sub(Su_Subcst1, Cl_output0) -> Su_C02
  Log(Su_C02) -> Lo_output0
    Mul(Su_C0, Lo_output0) -> Mu_C0
Log(Cl_output0) -> Lo_output02
  Mul(Ca_output0, Lo_output02) -> Mu_C02
    Add(Mu_C0, Mu_C02) -> Ad_C0
      Neg(Ad_C0) -> Ne_Y0
        ReduceSum(Ne_Y0) -> Re_reduced0
          Reshape(Re_reduced0, Re_Reshapecst) -> Y
output: name='Y' type=dtype('float32') shape=None
output: name='Y_grad' type=dtype('float32') shape=None
benchmark
def loss(x1, x2, eps=1e-5):
    pr = expit(x2)
    cl = numpy.clip(pr, eps, 1 - eps)
    lo = - (1 - x1) * numpy.log(1 - cl) - x1 * numpy.log(cl)
    return lo


fct_numpy = lambda x1, x2: (loss(x1, x2).mean(), expit(x2) - x1)

rows = benchmark(
    'grad_sigmoid_neg_log_loss_error', fct_onx, fct_numpy,
    (numpy.random.randn(1000, 1) > 0).astype(numpy.int64),
    numpy.random.randn(1000, 10).astype(numpy.float32))

all_rows.extend(rows)
piv = pandas.DataFrame(rows).pivot('dim', 'impl', 'average')
piv
  0%|          | 0/8 [00:00<?, ?it/s]
 12%|#2        | 1/8 [00:01<00:08,  1.28s/it]
 25%|##5       | 2/8 [00:02<00:07,  1.33s/it]
 38%|###7      | 3/8 [00:04<00:08,  1.72s/it]
 50%|#####     | 4/8 [00:07<00:08,  2.22s/it]
 62%|######2   | 5/8 [00:13<00:10,  3.37s/it]
 75%|#######5  | 6/8 [00:22<00:10,  5.48s/it]
 88%|########7 | 7/8 [00:32<00:06,  6.83s/it]
100%|##########| 8/8 [00:42<00:00,  7.72s/it]
100%|##########| 8/8 [00:42<00:00,  5.25s/it]
Graph.
name = rows[0]['name']
ax = piv.plot(logx=True, logy=True)
ax.set_title(name + "\nlower is better")
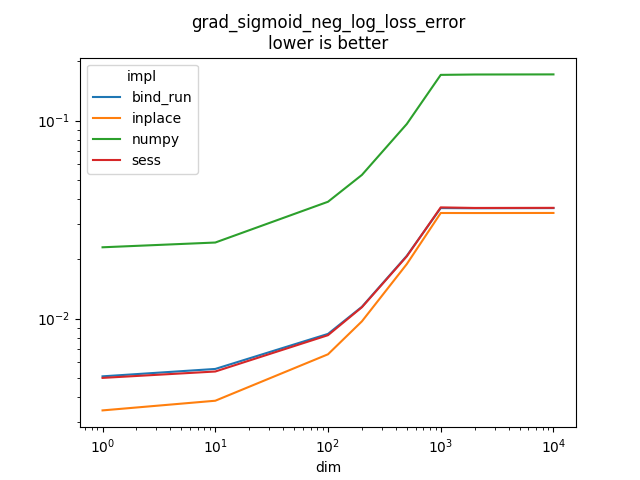
Text(0.5, 1.0, 'grad_sigmoid_neg_log_loss_error\nlower is better')
Results#
df = pandas.DataFrame(all_rows)
df
Pivot
piv = pandas.pivot_table(
    df, index=['name', 'impl'], columns='dim', values='average')
piv
print(piv)
dim                                          1      ...     10000
name                            impl                ...
axpy                            bind_run  0.002782  ...  0.003456
                                inplace   0.001250  ...  0.001958
                                numpy     0.001793  ...  0.003410
                                sess      0.002767  ...  0.003702
axpyw                           bind_run  0.003687  ...  0.004997
                                inplace   0.001453  ...  0.002665
                                numpy     0.005848  ...  0.012387
                                sess      0.003529  ...  0.005434
axpyw2                          bind_run  0.003962  ...  0.006011
                                inplace   0.001705  ...  0.003541
                                numpy     0.008325  ...  0.016455
                                sess      0.003817  ...  0.006654
copy                            bind_run  0.001894  ...  0.002060
                                inplace   0.000784  ...  0.000936
                                numpy     0.000465  ...  0.000901
                                sess      0.001891  ...  0.002248
grad_loss_absolute_error        bind_run  0.003353  ...  0.006323
                                inplace   0.001699  ...  0.004634
                                numpy     0.003884  ...  0.010731
                                sess      0.003226  ...  0.006461
grad_loss_elastic_error         bind_run  0.004826  ...  0.010019
                                inplace   0.003211  ...  0.008268
                                numpy     0.012537  ...  0.024850
                                sess      0.004714  ...  0.010262
grad_loss_square_error          bind_run  0.003310  ...  0.004150
                                inplace   0.001620  ...  0.002438
                                numpy     0.004805  ...  0.008714
                                sess      0.003173  ...  0.004484
grad_sigmoid_neg_log_loss_error bind_run  0.005106  ...  0.036125
                                inplace   0.003436  ...  0.034139
                                numpy     0.022901  ...  0.171022
                                sess      0.005014  ...  0.036229
n_penalty_elastic_error         bind_run  0.003379  ...  0.003987
                                inplace   0.002034  ...  0.002624
                                numpy     0.007092  ...  0.010282
                                sess      0.003317  ...  0.003880
update_penalty_elastic_error    bind_run  0.002516  ...  0.005660
                                inplace   0.001391  ...  0.004518
                                numpy     0.004918  ...  0.011955
                                sess      0.002521  ...  0.005859

[40 rows x 8 columns]
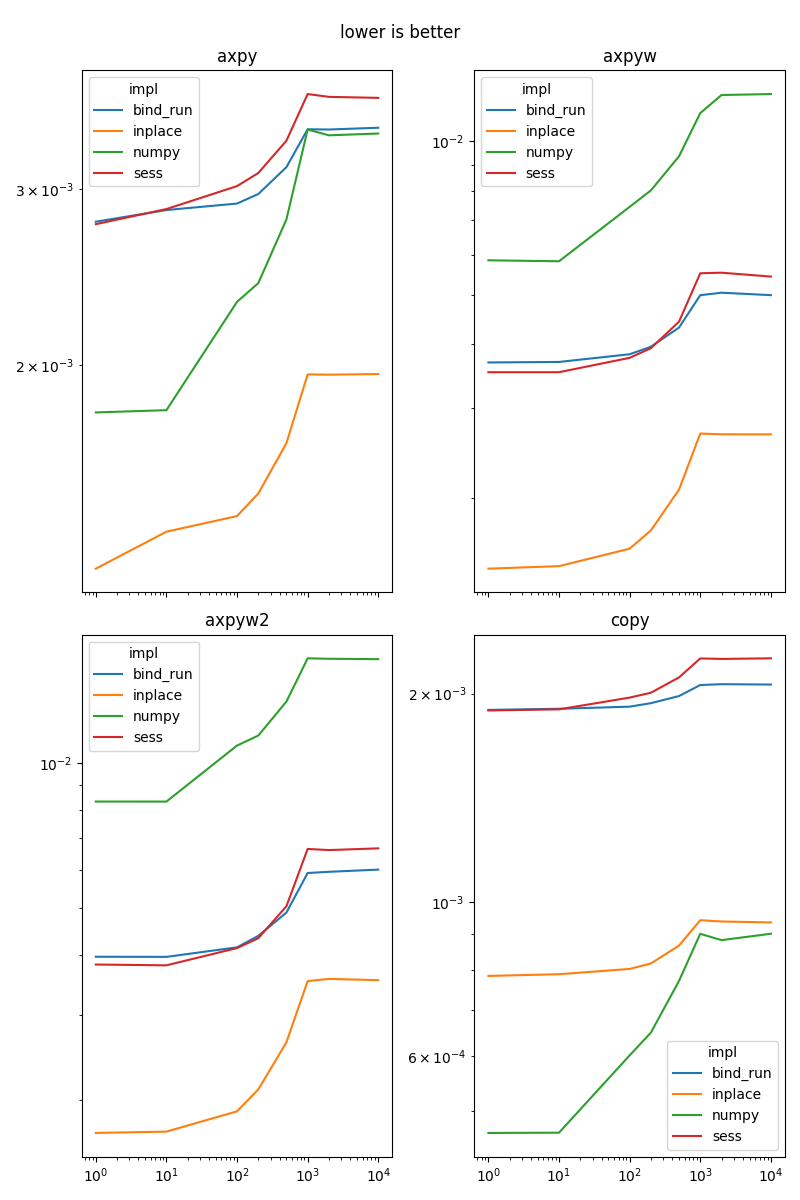
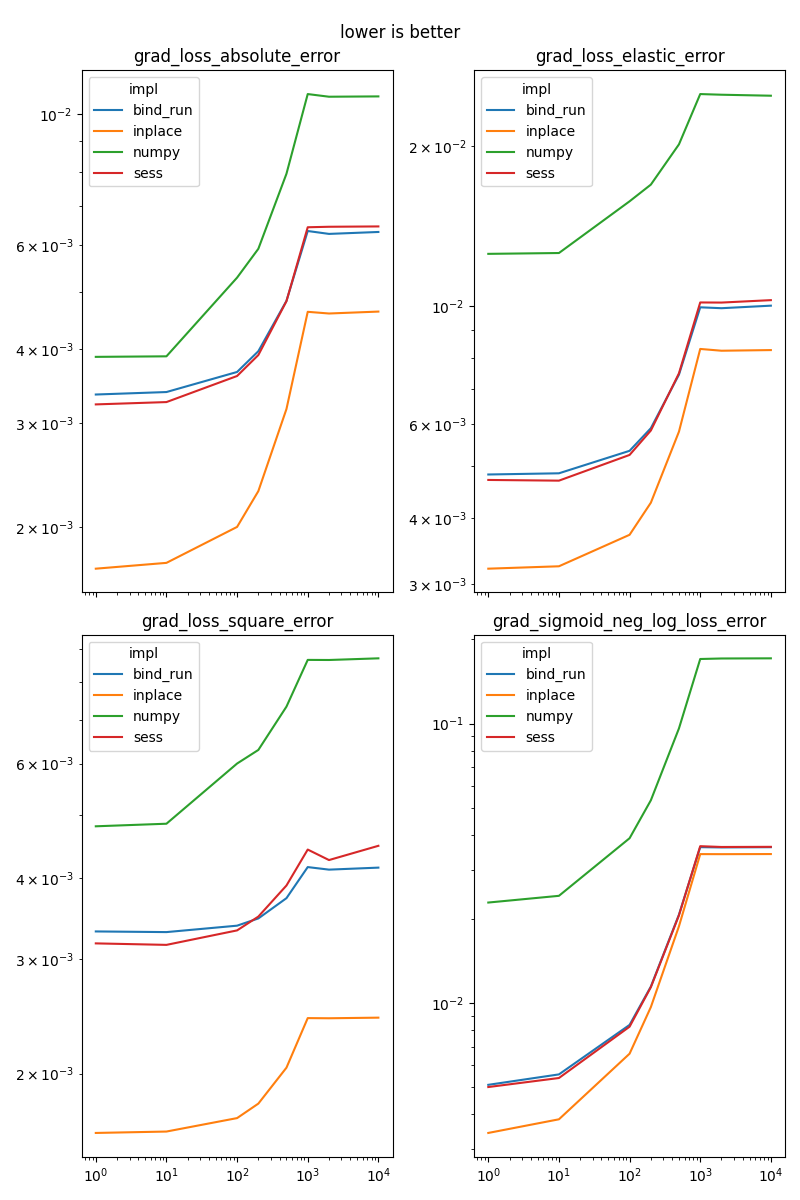
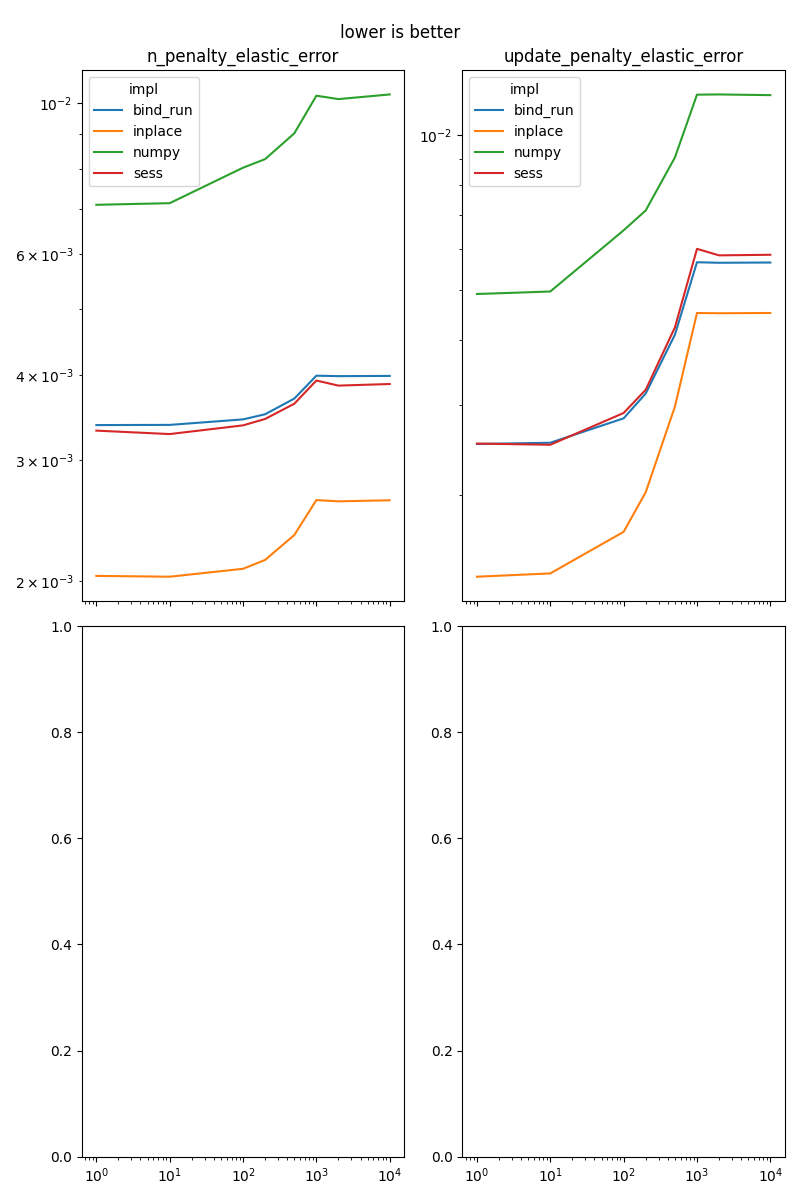
Graph.
fig, ax = None, None


for i, name in enumerate(sorted(set(df['name']))):
    if fig is None:
        fig, ax = plt.subplots(2, 2, figsize=(8, 12), sharex=True)
    x, y = (i % 4) // 2, (i % 4) % 2
    piv = df[df.name == name].pivot('dim', 'impl', 'average')
    piv.plot(ax=ax[x, y], logx=True, logy=True)
    ax[x, y].set_title(name)
    ax[x, y].xaxis.set_label_text("")
    if i % 4 == 3:
        fig.suptitle("lower is better")
        fig.tight_layout()
        fig, ax = None, None


if fig is not None:
    fig.suptitle("lower is better")
    fig.tight_layout()


# plt.show()
Total running time of the script: ( 1 minutes 47.654 seconds)