module pycode.profiling
Short summary
module pyquickhelper.pycode.profiling
Profiling helpers
Classes
class |
truncated documentation |
|---|---|
Graph structure to represent a profiling. |
|
|
Functions
function |
truncated documentation |
|---|---|
Converts class Stats into something readable for … |
|
Profiles the execution of a function. |
|
Converts profiling statistics into a Dataframe. |
|
Converts profiling statistics into a graphs. |
Properties
property |
truncated documentation |
|---|---|
Returns file:line. |
Static Methods
staticmethod |
truncated documentation |
|---|---|
Filters out node to be displayed by default. |
Methods
method |
truncated documentation |
|---|---|
Returns all nodes in the graph. |
|
usual |
|
This function is called by these lines. |
|
This function calls this node. |
|
Renders the results of a profiling interpreted with function @fn profile2graph. It can then be loaded with … |
|
Returns the root of the graph. |
|
Renders the results of a profiling interpreted with function @fn profile2graph as JSON. |
|
Prints the profiling to text. |
Documentation
Profiling helpers
- class pyquickhelper.pycode.profiling.ProfileNode(filename, line, func_name, nc1, nc2, tin, tall)[source]
Bases:
objectGraph structure to represent a profiling.
- Parameters:
filename – filename
line – line number
func_name – function name
nc1 – number of calls 1
nc2 – number of calls 2
tin – time spent in the function
tout – time spent in the function and in the sub functions
- _modules_ = {' _globals.py', '<frozen importlib._bootstrap>', '__future__.py', '_collections_abc.py', '_ios.py', 'abc.py', 'argparse.py', 'ast.py', 'contextlib.py', 'datetime.py', 'errors.py', 'functools.py', 'inspect.py', 'numbers.py', 'os.py', 'posixpath.py', 'six.py', 'sre_parse.py', 'subprocess.py', 'threading.py', 'types.py', 'typing.py', 'version.py', 'warnings.py', '~'}[source]
- as_dict(filter_node=None, sort_key='line')[source]
Renders the results of a profiling interpreted with function @fn profile2graph. It can then be loaded with a dataframe.
- Parameters:
filter_node – display only the nodes for which this function returns True, if None, the default function removes built-in function with small impact
sort_key – sort sub nodes by…
- Returns:
rows
- static filter_node_(node, info=None)[source]
Filters out node to be displayed by default.
- Parameters:
node – node
info – if the node is called by a function, this dictionary can be used to overwrite the attributes held by the node
- Returns:
boolean (True to keep, False to forget)
- to_json(filter_node=None, sort_key='line', as_str=True, **kwargs)[source]
Renders the results of a profiling interpreted with function @fn profile2graph as JSON.
- Parameters:
filter_node – display only the nodes for which this function returns True, if None, the default function removes built-in function with small impact
sort_key – sort sub nodes by…
as_str – converts the json into a string
kwargs – see
json.dumps()
- Returns:
rows
See notebook Hierchical profiling to see how to use the json output.
- to_text(filter_node=None, sort_key='line', fct_width=60)[source]
Prints the profiling to text.
- Parameters:
filter_node – display only the nodes for which this function returns True, if None, the default function removes built-in function with small impact
sort_key – sort sub nodes by…
- Returns:
rows
- pyquickhelper.pycode.profiling._process_pstats(ps, clean_text=None, verbose=False, fLOG=None)[source]
Converts class Stats into something readable for a dataframe.
- Parameters:
ps – instance of type
pstats.Stats()clean_text – function to clean function names
verbose – change verbosity
fLOG – logging function
- Returns:
list of rows
- pyquickhelper.pycode.profiling.profile(fct, sort='cumulative', rootrem=None, as_df=False, pyinst_format=None, return_results=False, **kwargs)[source]
Profiles the execution of a function.
- Parameters:
fct – function to profile
sort – see sort_stats
rootrem – root to remove in filenames
as_df – return the results as a dataframe and not text
pyinst_format – format for pyinstrument, if not empty, the function uses this module or raises an exception if not installed, the options are text, textu (text with colors), json, html
return_results – if True, return results as well (in the first position)
kwargs – additional parameters used to create the profiler
- Returns:
raw results, statistics text dump (or dataframe is as_df is True)
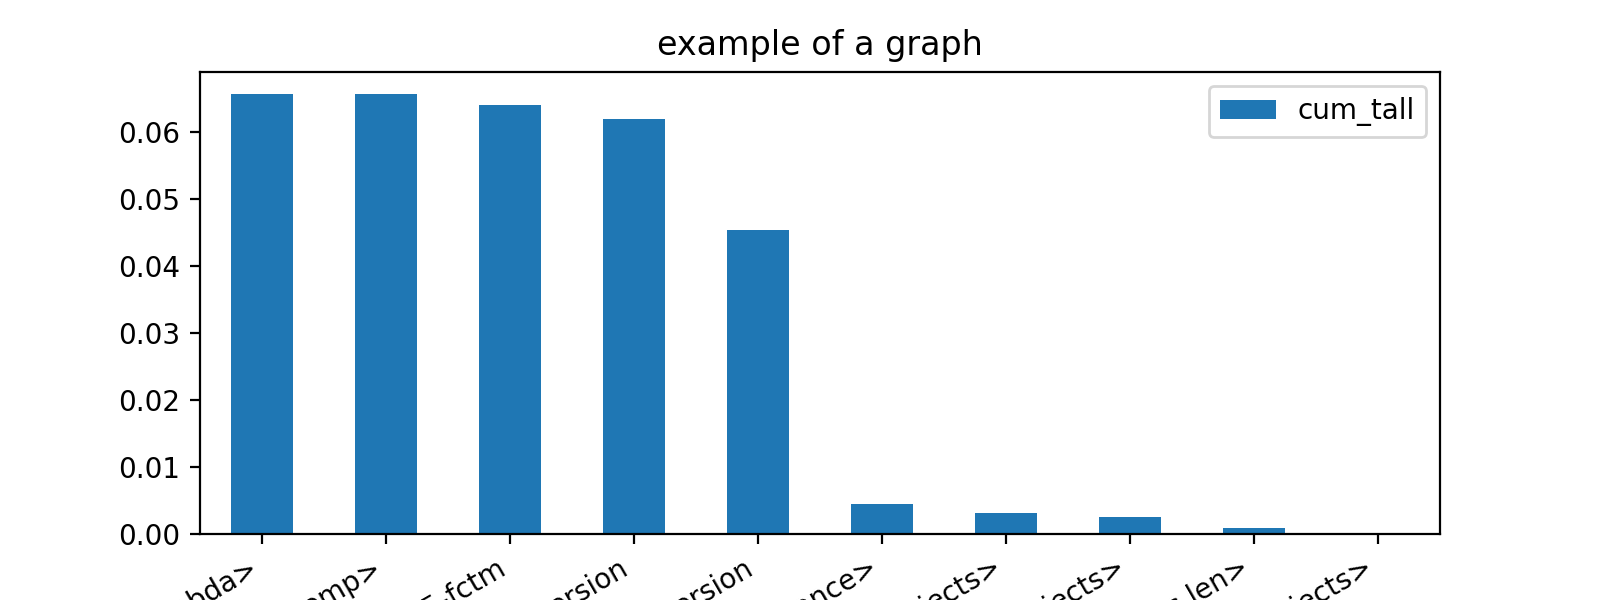
import matplotlib.pyplot as plt
from pyquickhelper.pycode.profiling import profile
from pyquickhelper.texthelper import compare_module_version

def fctm():
    return compare_module_version('0.20.4', '0.22.dev0')

pr, df = profile(lambda: [fctm() for i in range(0, 1000)], as_df=True)
ax = df[['namefct', 'cum_tall']].head(n=15).set_index(
    'namefct').plot(kind='bar', figsize=(8, 3), rot=30)
ax.set_title("example of a graph")
for la in ax.get_xticklabels():
    la.set_horizontalalignment('right');
plt.show()

- pyquickhelper.pycode.profiling.profile2df(ps, as_df=True, clean_text=None, verbose=False, fLOG=None)[source]
Converts profiling statistics into a Dataframe.
- Parameters:
ps – an instance of pstats
as_df – returns the results as a dataframe (True) or a list of dictionaries (False)
clean_text – function to clean function names
verbose – verbosity
fLOG – logging function
- Returns:
a DataFrame
import pstats
from pyquickhelper.pycode.profiling import profile2df

ps = pstats.Stats('bench_ortmodule_nn_gpu6.prof')
df = profile2df(pd)
print(df)
- pyquickhelper.pycode.profiling.profile2graph(ps, clean_text=None, verbose=False, fLOG=None)[source]
Converts profiling statistics into a graphs.
- Parameters:
ps –
an instance of pstats
clean_text – function to clean function names
verbose – verbosity
fLOG – logging function
- Returns:
an instance of class
ProfileNode
Hierarchical display for a profiling
pyinstrument has a nice display to show time spent and call stack at the same time. This function tries to replicate that display based on the results produced by module
cProfile. Here is an example.<<<
import time
from pyquickhelper.pycode.profiling import profile, profile2graph


def fct0(t):
    time.sleep(t)


def fct1(t):
    time.sleep(t)


def fct2():
    fct1(0.1)
    fct1(0.01)


def fct3():
    fct0(0.2)
    fct1(0.5)


def fct4():
    fct2()
    fct3()


ps = profile(fct4)[0]
root, nodes = profile2graph(ps, clean_text=lambda x: x.split('/')[-1])
text = root.to_text()
print(text)
>>>
    fct1                                                         --  3  3 -- 0.00002 0.61088 -- :11:fct1 (fct1)
        <built-in method time.sleep>                             --  3  3 -- 0.61086 0.61086 -- ~:0:<built-in method time.sleep> (<built-in method time.sleep>) +++
    fct4                                                         --  1  1 -- 0.00001 0.81115 -- :25:fct4 (fct4)
        fct2                                                     --  1  1 -- 0.00000 0.11031 -- :15:fct2 (fct2)
            fct1                                                 --  2  2 -- 0.00001 0.11030 -- :11:fct1 (fct1) +++
        fct3                                                     --  1  1 -- 0.00001 0.70084 -- :20:fct3 (fct3)
            fct0                                                 --  1  1 -- 0.00000 0.20026 -- :7:fct0 (fct0)
                <built-in method time.sleep>                     --  1  1 -- 0.20025 0.20025 -- ~:0:<built-in method time.sleep> (<built-in method time.sleep>) +++
            fct1                                                 --  1  1 -- 0.00001 0.50058 -- :11:fct1 (fct1) +++
    <built-in method time.sleep>                                 --  4  4 -- 0.81111 0.81111 -- ~:0:<built-in method time.sleep> (<built-in method time.sleep>)
