1A.data - Visualisation des données - cartes
Links: notebook
, html, PDF
, python
, slides, GitHub
Les cartes sont probablement les graphes les plus longs à mettre en place. Si les coordonnées longitude lattitude sont les plus utilisées, il est possible de les considérer comme des coordonnées carthésiennes sur une grande surface (sphérique). Il faut passer par une projection spécifique dans le plan. Il faut également ajouter des repères géographiques pour lire efficacement une carte comme les frontières des pays, les rivières… Tout ça prend du temps.
%matplotlib inline
from jyquickhelper import add_notebook_menu
add_notebook_menu()
Cartographie
Dessiner une carte n’est pas difficile en soit. Toute la difficulté vient du fait qu’on a besoin pour lire cette carte de point de référence : les rues pour une ville, les frontières pour un département, une région, un pays, les fleuves et montagnes pour une carte représentation des données démographiques. Ces informations sont importantes pour situer l’information représentée par le graphique. Si vous n’avez pas besoin de tout ça, les formules suivantes vous suffiront :
Ces fonctionnalités sont disponibles via le module geopy. Dans le cas contraire, voici quelques directions :
cartopy : le module est une surcouche du module matplotlib, il convertit les coordonnées géographiques et ajoutent quelques éléments de paysages (frontières, rivières…). Il ne contient pas tout comme la définition des départements français.
shapely : ce module est utile pour dessiner des aires sur des cartes. Sous Windows, il faut l’installer depuis Unofficial Windows Binaries for Python Extension Packages car il inclut la DLL
geos_c.dll
qui vient de GEOS. Dans le cas contraire, il faut installer GEOS, ce qui prend pas mal de temps. Il est utilisé par cartopy.
Il en existe d’autres mais leur installation recèle quelques difficultés que je n’ai pas toujours eu la patience de contourner :
mapnik : l’installation sur Windows est réservée aux connaisseurs, trop compliquée sous Windows.
geopandas manipule les coordonnées géographiques dans des dataframe et implémente des graphiques simples.
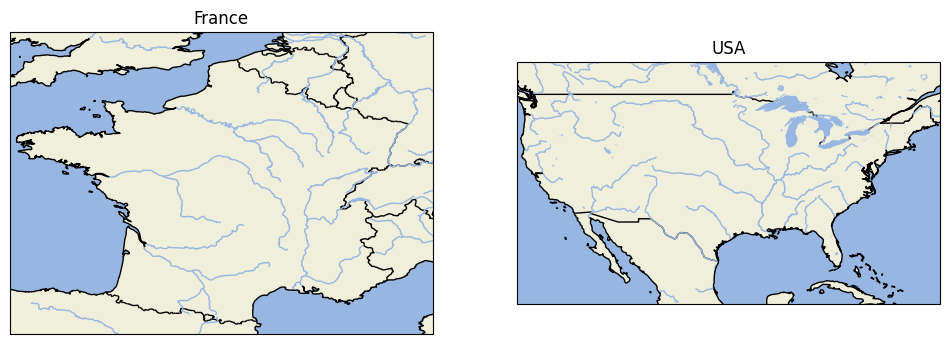
L’exemple qui suit utilise cartopy. Comme beaucoup de modules, il contient principalement des informations que le territoire américains.
import cartopy.crs as ccrs
import matplotlib.pyplot as plt
import cartopy.feature as cfeature
projection = ccrs.PlateCarree()
fig = plt.figure(figsize=(12, 6))
ax = fig.add_subplot(1, 2, 1, projection=projection)
ax.add_feature(cfeature.BORDERS)
ax.add_feature(cfeature.LAKES)
ax.add_feature(cfeature.LAND)
ax.add_feature(cfeature.OCEAN)
ax.add_feature(cfeature.RIVERS)
ax.add_feature(cfeature.COASTLINE)
ax.set_extent([-5, 9, 42, 52])
ax.set_title("France")
ax = fig.add_subplot(1, 2, 2, projection=projection)
ax.add_feature(cfeature.BORDERS)
ax.add_feature(cfeature.LAKES)
ax.add_feature(cfeature.LAND)
ax.add_feature(cfeature.OCEAN)
ax.add_feature(cfeature.RIVERS)
ax.add_feature(cfeature.COASTLINE)
ax.set_extent([-125, -66.5, 20, 50])
ax.set_title("USA");
c:Python372_x64libsite-packagescartopyio__init__.py:260: DownloadWarning: Downloading: http://naciscdn.org/naturalearth/110m/physical/ne_110m_land.zip warnings.warn('Downloading: {}'.format(url), DownloadWarning)
Error in callback <function install_repl_displayhook.<locals>.post_execute at 0x0000024642577E18> (for post_execute):
---------------------------------------------------------------------------
gaierror Traceback (most recent call last)
c:\Python372_x64\lib\urllib\request.py in do_open(self, http_class, req, **http_conn_args)
1316 h.request(req.get_method(), req.selector, req.data, headers,
-> 1317 encode_chunked=req.has_header('Transfer-encoding'))
1318 except OSError as err: # timeout error
c:\Python372_x64\lib\http\client.py in request(self, method, url, body, headers, encode_chunked)
1228 """Send a complete request to the server."""
-> 1229 self._send_request(method, url, body, headers, encode_chunked)
1230
c:\Python372_x64\lib\http\client.py in _send_request(self, method, url, body, headers, encode_chunked)
1274 body = _encode(body, 'body')
-> 1275 self.endheaders(body, encode_chunked=encode_chunked)
1276
c:\Python372_x64\lib\http\client.py in endheaders(self, message_body, encode_chunked)
1223 raise CannotSendHeader()
-> 1224 self._send_output(message_body, encode_chunked=encode_chunked)
1225
c:\Python372_x64\lib\http\client.py in _send_output(self, message_body, encode_chunked)
1015 del self._buffer[:]
-> 1016 self.send(msg)
1017
c:\Python372_x64\lib\http\client.py in send(self, data)
955 if self.auto_open:
--> 956 self.connect()
957 else:
c:\Python372_x64\lib\http\client.py in connect(self)
927 self.sock = self._create_connection(
--> 928 (self.host,self.port), self.timeout, self.source_address)
929 self.sock.setsockopt(socket.IPPROTO_TCP, socket.TCP_NODELAY, 1)
c:\Python372_x64\lib\socket.py in create_connection(address, timeout, source_address)
706 err = None
--> 707 for res in getaddrinfo(host, port, 0, SOCK_STREAM):
708 af, socktype, proto, canonname, sa = res
c:\Python372_x64\lib\socket.py in getaddrinfo(host, port, family, type, proto, flags)
747 addrlist = []
--> 748 for res in _socket.getaddrinfo(host, port, family, type, proto, flags):
749 af, socktype, proto, canonname, sa = res
gaierror: [Errno 11001] getaddrinfo failed
During handling of the above exception, another exception occurred:
URLError Traceback (most recent call last)
c:\Python372_x64\lib\site-packages\matplotlib\pyplot.py in post_execute()
107 def post_execute():
108 if matplotlib.is_interactive():
--> 109 draw_all()
110
111 # IPython >= 2
c:\Python372_x64\lib\site-packages\matplotlib\_pylab_helpers.py in draw_all(cls, force)
130 for f_mgr in cls.get_all_fig_managers():
131 if force or f_mgr.canvas.figure.stale:
--> 132 f_mgr.canvas.draw_idle()
133
134 atexit.register(Gcf.destroy_all)
c:\Python372_x64\lib\site-packages\matplotlib\backend_bases.py in draw_idle(self, *args, **kwargs)
1897 if not self._is_idle_drawing:
1898 with self._idle_draw_cntx():
-> 1899 self.draw(*args, **kwargs)
1900
1901 def draw_cursor(self, event):
c:\Python372_x64\lib\site-packages\matplotlib\backends\backend_agg.py in draw(self)
400 toolbar = self.toolbar
401 try:
--> 402 self.figure.draw(self.renderer)
403 # A GUI class may be need to update a window using this draw, so
404 # don't forget to call the superclass.
c:\Python372_x64\lib\site-packages\matplotlib\artist.py in draw_wrapper(artist, renderer, *args, **kwargs)
48 renderer.start_filter()
49
---> 50 return draw(artist, renderer, *args, **kwargs)
51 finally:
52 if artist.get_agg_filter() is not None:
c:\Python372_x64\lib\site-packages\matplotlib\figure.py in draw(self, renderer)
1647
1648 mimage._draw_list_compositing_images(
-> 1649 renderer, self, artists, self.suppressComposite)
1650
1651 renderer.close_group('figure')
c:\Python372_x64\lib\site-packages\matplotlib\image.py in _draw_list_compositing_images(renderer, parent, artists, suppress_composite)
136 if not_composite or not has_images:
137 for a in artists:
--> 138 a.draw(renderer)
139 else:
140 # Composite any adjacent images together
c:\Python372_x64\lib\site-packages\matplotlib\artist.py in draw_wrapper(artist, renderer, *args, **kwargs)
48 renderer.start_filter()
49
---> 50 return draw(artist, renderer, *args, **kwargs)
51 finally:
52 if artist.get_agg_filter() is not None:
c:\Python372_x64\lib\site-packages\cartopy\mpl\geoaxes.py in draw(self, renderer, inframe)
386
387 return matplotlib.axes.Axes.draw(self, renderer=renderer,
--> 388 inframe=inframe)
389
390 def __str__(self):
c:\Python372_x64\lib\site-packages\matplotlib\artist.py in draw_wrapper(artist, renderer, *args, **kwargs)
48 renderer.start_filter()
49
---> 50 return draw(artist, renderer, *args, **kwargs)
51 finally:
52 if artist.get_agg_filter() is not None:
c:\Python372_x64\lib\site-packages\matplotlib\axes\_base.py in draw(self, renderer, inframe)
2626 renderer.stop_rasterizing()
2627
-> 2628 mimage._draw_list_compositing_images(renderer, self, artists)
2629
2630 renderer.close_group('axes')
c:\Python372_x64\lib\site-packages\matplotlib\image.py in _draw_list_compositing_images(renderer, parent, artists, suppress_composite)
136 if not_composite or not has_images:
137 for a in artists:
--> 138 a.draw(renderer)
139 else:
140 # Composite any adjacent images together
c:\Python372_x64\lib\site-packages\matplotlib\artist.py in draw_wrapper(artist, renderer, *args, **kwargs)
48 renderer.start_filter()
49
---> 50 return draw(artist, renderer, *args, **kwargs)
51 finally:
52 if artist.get_agg_filter() is not None:
c:\Python372_x64\lib\site-packages\cartopy\mpl\feature_artist.py in draw(self, renderer, *args, **kwargs)
162 except ValueError:
163 warnings.warn('Unable to determine extent. Defaulting to global.')
--> 164 geoms = self._feature.intersecting_geometries(extent)
165
166 # Combine all the keyword args in priority order.
c:\Python372_x64\lib\site-packages\cartopy\feature\__init__.py in intersecting_geometries(self, extent)
301 """
302 self.scaler.scale_from_extent(extent)
--> 303 return super(NaturalEarthFeature, self).intersecting_geometries(extent)
304
305 def with_scale(self, new_scale):
c:\Python372_x64\lib\site-packages\cartopy\feature\__init__.py in intersecting_geometries(self, extent)
118 extent_geom = sgeom.box(extent[0], extent[2],
119 extent[1], extent[3])
--> 120 return (geom for geom in self.geometries() if
121 geom is not None and extent_geom.intersects(geom))
122 else:
c:\Python372_x64\lib\site-packages\cartopy\feature\__init__.py in geometries(self)
285 path = shapereader.natural_earth(resolution=self.scale,
286 category=self.category,
--> 287 name=self.name)
288 geometries = tuple(shapereader.Reader(path).geometries())
289 _NATURAL_EARTH_GEOM_CACHE[key] = geometries
c:\Python372_x64\lib\site-packages\cartopy\io\shapereader.py in natural_earth(resolution, category, name)
357 format_dict = {'config': config, 'category': category,
358 'name': name, 'resolution': resolution}
--> 359 return ne_downloader.path(format_dict)
360
361
c:\Python372_x64\lib\site-packages\cartopy\io\__init__.py in path(self, format_dict)
220 else:
221 # we need to download the file
--> 222 result_path = self.acquire_resource(target_path, format_dict)
223
224 return result_path
c:\Python372_x64\lib\site-packages\cartopy\io\shapereader.py in acquire_resource(self, target_path, format_dict)
412 url = self.url(format_dict)
413
--> 414 shapefile_online = self._urlopen(url)
415
416 zfh = ZipFile(six.BytesIO(shapefile_online.read()), 'r')
c:\Python372_x64\lib\site-packages\cartopy\io\__init__.py in _urlopen(self, url)
259 """
260 warnings.warn('Downloading: {}'.format(url), DownloadWarning)
--> 261 return urlopen(url)
262
263 @staticmethod
c:\Python372_x64\lib\urllib\request.py in urlopen(url, data, timeout, cafile, capath, cadefault, context)
220 else:
221 opener = _opener
--> 222 return opener.open(url, data, timeout)
223
224 def install_opener(opener):
c:\Python372_x64\lib\urllib\request.py in open(self, fullurl, data, timeout)
523 req = meth(req)
524
--> 525 response = self._open(req, data)
526
527 # post-process response
c:\Python372_x64\lib\urllib\request.py in _open(self, req, data)
541 protocol = req.type
542 result = self._call_chain(self.handle_open, protocol, protocol +
--> 543 '_open', req)
544 if result:
545 return result
c:\Python372_x64\lib\urllib\request.py in _call_chain(self, chain, kind, meth_name, *args)
501 for handler in handlers:
502 func = getattr(handler, meth_name)
--> 503 result = func(*args)
504 if result is not None:
505 return result
c:\Python372_x64\lib\urllib\request.py in http_open(self, req)
1343
1344 def http_open(self, req):
-> 1345 return self.do_open(http.client.HTTPConnection, req)
1346
1347 http_request = AbstractHTTPHandler.do_request_
c:\Python372_x64\lib\urllib\request.py in do_open(self, http_class, req, **http_conn_args)
1317 encode_chunked=req.has_header('Transfer-encoding'))
1318 except OSError as err: # timeout error
-> 1319 raise URLError(err)
1320 r = h.getresponse()
1321 except:
URLError: <urlopen error [Errno 11001] getaddrinfo failed>
---------------------------------------------------------------------------
gaierror Traceback (most recent call last)
c:\Python372_x64\lib\urllib\request.py in do_open(self, http_class, req, **http_conn_args)
1316 h.request(req.get_method(), req.selector, req.data, headers,
-> 1317 encode_chunked=req.has_header('Transfer-encoding'))
1318 except OSError as err: # timeout error
c:\Python372_x64\lib\http\client.py in request(self, method, url, body, headers, encode_chunked)
1228 """Send a complete request to the server."""
-> 1229 self._send_request(method, url, body, headers, encode_chunked)
1230
c:\Python372_x64\lib\http\client.py in _send_request(self, method, url, body, headers, encode_chunked)
1274 body = _encode(body, 'body')
-> 1275 self.endheaders(body, encode_chunked=encode_chunked)
1276
c:\Python372_x64\lib\http\client.py in endheaders(self, message_body, encode_chunked)
1223 raise CannotSendHeader()
-> 1224 self._send_output(message_body, encode_chunked=encode_chunked)
1225
c:\Python372_x64\lib\http\client.py in _send_output(self, message_body, encode_chunked)
1015 del self._buffer[:]
-> 1016 self.send(msg)
1017
c:\Python372_x64\lib\http\client.py in send(self, data)
955 if self.auto_open:
--> 956 self.connect()
957 else:
c:\Python372_x64\lib\http\client.py in connect(self)
927 self.sock = self._create_connection(
--> 928 (self.host,self.port), self.timeout, self.source_address)
929 self.sock.setsockopt(socket.IPPROTO_TCP, socket.TCP_NODELAY, 1)
c:\Python372_x64\lib\socket.py in create_connection(address, timeout, source_address)
706 err = None
--> 707 for res in getaddrinfo(host, port, 0, SOCK_STREAM):
708 af, socktype, proto, canonname, sa = res
c:\Python372_x64\lib\socket.py in getaddrinfo(host, port, family, type, proto, flags)
747 addrlist = []
--> 748 for res in _socket.getaddrinfo(host, port, family, type, proto, flags):
749 af, socktype, proto, canonname, sa = res
gaierror: [Errno 11001] getaddrinfo failed
During handling of the above exception, another exception occurred:
URLError Traceback (most recent call last)
c:\Python372_x64\lib\site-packages\IPython\core\formatters.py in __call__(self, obj)
339 pass
340 else:
--> 341 return printer(obj)
342 # Finally look for special method names
343 method = get_real_method(obj, self.print_method)
c:\Python372_x64\lib\site-packages\IPython\core\pylabtools.py in <lambda>(fig)
242
243 if 'png' in formats:
--> 244 png_formatter.for_type(Figure, lambda fig: print_figure(fig, 'png', **kwargs))
245 if 'retina' in formats or 'png2x' in formats:
246 png_formatter.for_type(Figure, lambda fig: retina_figure(fig, **kwargs))
c:\Python372_x64\lib\site-packages\IPython\core\pylabtools.py in print_figure(fig, fmt, bbox_inches, **kwargs)
126
127 bytes_io = BytesIO()
--> 128 fig.canvas.print_figure(bytes_io, **kw)
129 data = bytes_io.getvalue()
130 if fmt == 'svg':
c:\Python372_x64\lib\site-packages\matplotlib\backend_bases.py in print_figure(self, filename, dpi, facecolor, edgecolor, orientation, format, bbox_inches, **kwargs)
2047 orientation=orientation,
2048 dryrun=True,
-> 2049 **kwargs)
2050 renderer = self.figure._cachedRenderer
2051 bbox_artists = kwargs.pop("bbox_extra_artists", None)
c:\Python372_x64\lib\site-packages\matplotlib\backends\backend_agg.py in print_png(self, filename_or_obj, *args, **kwargs)
508
509 """
--> 510 FigureCanvasAgg.draw(self)
511 renderer = self.get_renderer()
512
c:\Python372_x64\lib\site-packages\matplotlib\backends\backend_agg.py in draw(self)
400 toolbar = self.toolbar
401 try:
--> 402 self.figure.draw(self.renderer)
403 # A GUI class may be need to update a window using this draw, so
404 # don't forget to call the superclass.
c:\Python372_x64\lib\site-packages\matplotlib\artist.py in draw_wrapper(artist, renderer, *args, **kwargs)
48 renderer.start_filter()
49
---> 50 return draw(artist, renderer, *args, **kwargs)
51 finally:
52 if artist.get_agg_filter() is not None:
c:\Python372_x64\lib\site-packages\matplotlib\figure.py in draw(self, renderer)
1647
1648 mimage._draw_list_compositing_images(
-> 1649 renderer, self, artists, self.suppressComposite)
1650
1651 renderer.close_group('figure')
c:\Python372_x64\lib\site-packages\matplotlib\image.py in _draw_list_compositing_images(renderer, parent, artists, suppress_composite)
136 if not_composite or not has_images:
137 for a in artists:
--> 138 a.draw(renderer)
139 else:
140 # Composite any adjacent images together
c:\Python372_x64\lib\site-packages\matplotlib\artist.py in draw_wrapper(artist, renderer, *args, **kwargs)
48 renderer.start_filter()
49
---> 50 return draw(artist, renderer, *args, **kwargs)
51 finally:
52 if artist.get_agg_filter() is not None:
c:\Python372_x64\lib\site-packages\cartopy\mpl\geoaxes.py in draw(self, renderer, inframe)
386
387 return matplotlib.axes.Axes.draw(self, renderer=renderer,
--> 388 inframe=inframe)
389
390 def __str__(self):
c:\Python372_x64\lib\site-packages\matplotlib\artist.py in draw_wrapper(artist, renderer, *args, **kwargs)
48 renderer.start_filter()
49
---> 50 return draw(artist, renderer, *args, **kwargs)
51 finally:
52 if artist.get_agg_filter() is not None:
c:\Python372_x64\lib\site-packages\matplotlib\axes\_base.py in draw(self, renderer, inframe)
2626 renderer.stop_rasterizing()
2627
-> 2628 mimage._draw_list_compositing_images(renderer, self, artists)
2629
2630 renderer.close_group('axes')
c:\Python372_x64\lib\site-packages\matplotlib\image.py in _draw_list_compositing_images(renderer, parent, artists, suppress_composite)
136 if not_composite or not has_images:
137 for a in artists:
--> 138 a.draw(renderer)
139 else:
140 # Composite any adjacent images together
c:\Python372_x64\lib\site-packages\matplotlib\artist.py in draw_wrapper(artist, renderer, *args, **kwargs)
48 renderer.start_filter()
49
---> 50 return draw(artist, renderer, *args, **kwargs)
51 finally:
52 if artist.get_agg_filter() is not None:
c:\Python372_x64\lib\site-packages\cartopy\mpl\feature_artist.py in draw(self, renderer, *args, **kwargs)
162 except ValueError:
163 warnings.warn('Unable to determine extent. Defaulting to global.')
--> 164 geoms = self._feature.intersecting_geometries(extent)
165
166 # Combine all the keyword args in priority order.
c:\Python372_x64\lib\site-packages\cartopy\feature\__init__.py in intersecting_geometries(self, extent)
301 """
302 self.scaler.scale_from_extent(extent)
--> 303 return super(NaturalEarthFeature, self).intersecting_geometries(extent)
304
305 def with_scale(self, new_scale):
c:\Python372_x64\lib\site-packages\cartopy\feature\__init__.py in intersecting_geometries(self, extent)
118 extent_geom = sgeom.box(extent[0], extent[2],
119 extent[1], extent[3])
--> 120 return (geom for geom in self.geometries() if
121 geom is not None and extent_geom.intersects(geom))
122 else:
c:\Python372_x64\lib\site-packages\cartopy\feature\__init__.py in geometries(self)
285 path = shapereader.natural_earth(resolution=self.scale,
286 category=self.category,
--> 287 name=self.name)
288 geometries = tuple(shapereader.Reader(path).geometries())
289 _NATURAL_EARTH_GEOM_CACHE[key] = geometries
c:\Python372_x64\lib\site-packages\cartopy\io\shapereader.py in natural_earth(resolution, category, name)
357 format_dict = {'config': config, 'category': category,
358 'name': name, 'resolution': resolution}
--> 359 return ne_downloader.path(format_dict)
360
361
c:\Python372_x64\lib\site-packages\cartopy\io\__init__.py in path(self, format_dict)
220 else:
221 # we need to download the file
--> 222 result_path = self.acquire_resource(target_path, format_dict)
223
224 return result_path
c:\Python372_x64\lib\site-packages\cartopy\io\shapereader.py in acquire_resource(self, target_path, format_dict)
412 url = self.url(format_dict)
413
--> 414 shapefile_online = self._urlopen(url)
415
416 zfh = ZipFile(six.BytesIO(shapefile_online.read()), 'r')
c:\Python372_x64\lib\site-packages\cartopy\io\__init__.py in _urlopen(self, url)
259 """
260 warnings.warn('Downloading: {}'.format(url), DownloadWarning)
--> 261 return urlopen(url)
262
263 @staticmethod
c:\Python372_x64\lib\urllib\request.py in urlopen(url, data, timeout, cafile, capath, cadefault, context)
220 else:
221 opener = _opener
--> 222 return opener.open(url, data, timeout)
223
224 def install_opener(opener):
c:\Python372_x64\lib\urllib\request.py in open(self, fullurl, data, timeout)
523 req = meth(req)
524
--> 525 response = self._open(req, data)
526
527 # post-process response
c:\Python372_x64\lib\urllib\request.py in _open(self, req, data)
541 protocol = req.type
542 result = self._call_chain(self.handle_open, protocol, protocol +
--> 543 '_open', req)
544 if result:
545 return result
c:\Python372_x64\lib\urllib\request.py in _call_chain(self, chain, kind, meth_name, *args)
501 for handler in handlers:
502 func = getattr(handler, meth_name)
--> 503 result = func(*args)
504 if result is not None:
505 return result
c:\Python372_x64\lib\urllib\request.py in http_open(self, req)
1343
1344 def http_open(self, req):
-> 1345 return self.do_open(http.client.HTTPConnection, req)
1346
1347 http_request = AbstractHTTPHandler.do_request_
c:\Python372_x64\lib\urllib\request.py in do_open(self, http_class, req, **http_conn_args)
1317 encode_chunked=req.has_header('Transfer-encoding'))
1318 except OSError as err: # timeout error
-> 1319 raise URLError(err)
1320 r = h.getresponse()
1321 except:
URLError: <urlopen error [Errno 11001] getaddrinfo failed>
<Figure size 864x432 with 2 Axes>
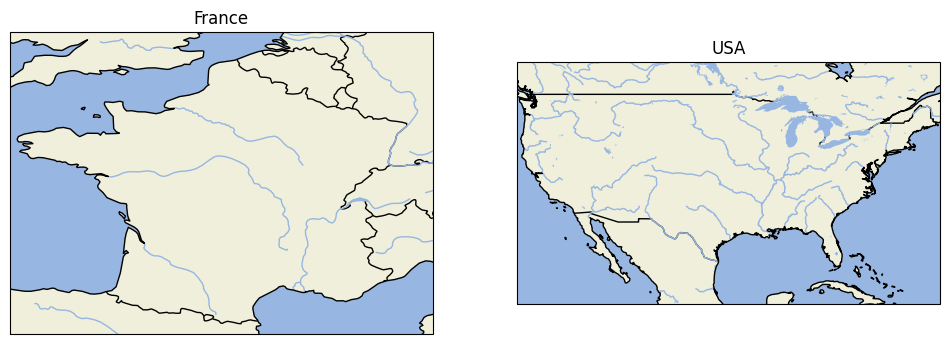
On peut améliorer la précision en précisant l’échelle avec la méthode with_scale qui propose trois résolution 10m, 50m, 110m. La module cartopy n’inclut que la résolution 110m, le reste doit être téléchargé. La première exécution prend un peu de temps.
projection = ccrs.PlateCarree()
fig = plt.figure(figsize=(12, 6))
ax = fig.add_subplot(1, 2, 1, projection=projection)
ax.add_feature(cfeature.BORDERS.with_scale('50m'))
ax.add_feature(cfeature.LAKES.with_scale('50m'))
ax.add_feature(cfeature.LAND.with_scale('50m'))
ax.add_feature(cfeature.OCEAN.with_scale('50m'))
ax.add_feature(cfeature.RIVERS.with_scale('50m'))
ax.add_feature(cfeature.COASTLINE.with_scale('50m'))
ax.set_extent([-5, 9, 42, 52])
ax.set_title("France")
ax = fig.add_subplot(1, 2, 2, projection=projection)
ax.add_feature(cfeature.BORDERS.with_scale('50m'))
ax.add_feature(cfeature.LAKES.with_scale('50m'))
ax.add_feature(cfeature.LAND.with_scale('50m'))
ax.add_feature(cfeature.OCEAN.with_scale('50m'))
ax.add_feature(cfeature.RIVERS.with_scale('50m'))
ax.add_feature(cfeature.COASTLINE.with_scale('50m'))
ax.set_extent([-125, -66.5, 20, 50])
ax.set_title("USA");
c:Python372_x64libsite-packagescartopyio__init__.py:260: DownloadWarning: Downloading: http://naciscdn.org/naturalearth/50m/physical/ne_50m_land.zip warnings.warn('Downloading: {}'.format(url), DownloadWarning) c:Python372_x64libsite-packagescartopyio__init__.py:260: DownloadWarning: Downloading: http://naciscdn.org/naturalearth/50m/physical/ne_50m_ocean.zip warnings.warn('Downloading: {}'.format(url), DownloadWarning) c:Python372_x64libsite-packagescartopyio__init__.py:260: DownloadWarning: Downloading: http://naciscdn.org/naturalearth/50m/cultural/ne_50m_admin_0_boundary_lines_land.zip warnings.warn('Downloading: {}'.format(url), DownloadWarning) c:Python372_x64libsite-packagescartopyio__init__.py:260: DownloadWarning: Downloading: http://naciscdn.org/naturalearth/50m/physical/ne_50m_lakes.zip warnings.warn('Downloading: {}'.format(url), DownloadWarning) c:Python372_x64libsite-packagescartopyio__init__.py:260: DownloadWarning: Downloading: http://naciscdn.org/naturalearth/50m/physical/ne_50m_rivers_lake_centerlines.zip warnings.warn('Downloading: {}'.format(url), DownloadWarning) c:Python372_x64libsite-packagescartopyio__init__.py:260: DownloadWarning: Downloading: http://naciscdn.org/naturalearth/50m/physical/ne_50m_coastline.zip warnings.warn('Downloading: {}'.format(url), DownloadWarning)

On peut ajouter un peu plus d’information avec la méthode stock_img.
import cartopy.crs as ccrs
import matplotlib.pyplot as plt
import cartopy.feature as cfeature
projection = ccrs.PlateCarree()
fig = plt.figure(figsize=(12, 6))
ax = fig.add_subplot(1, 2, 1, projection=projection)
ax.add_feature(cfeature.BORDERS.with_scale('50m'))
ax.add_feature(cfeature.LAKES.with_scale('50m'))
ax.add_feature(cfeature.LAND.with_scale('50m'))
ax.add_feature(cfeature.OCEAN.with_scale('50m'))
ax.add_feature(cfeature.RIVERS.with_scale('50m'))
ax.add_feature(cfeature.COASTLINE.with_scale('50m'))
ax.set_extent([-5, 9, 42, 52])
ax.set_title("France")
ax.stock_img()
ax = fig.add_subplot(1, 2, 2, projection=projection)
ax.add_feature(cfeature.BORDERS.with_scale('50m'))
ax.add_feature(cfeature.LAKES.with_scale('50m'))
ax.add_feature(cfeature.LAND.with_scale('50m'))
ax.add_feature(cfeature.OCEAN.with_scale('50m'))
ax.add_feature(cfeature.RIVERS.with_scale('50m'))
ax.add_feature(cfeature.COASTLINE.with_scale('50m'))
ax.set_extent([-125, -66.5, 20, 50])
ax.stock_img()
ax.set_title("USA");

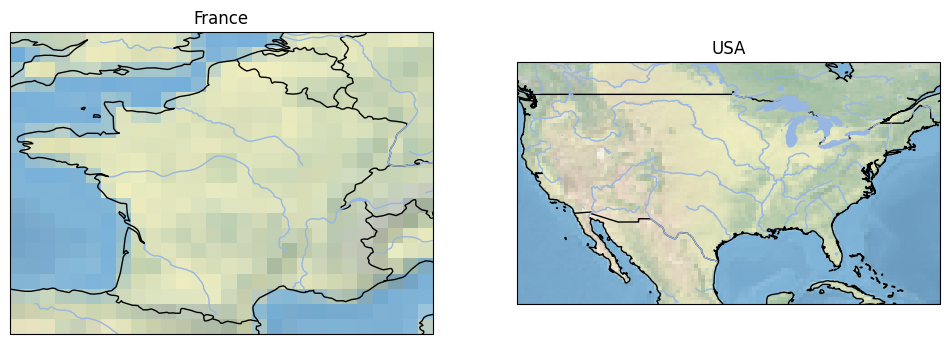
Cette fonction plaque une portion d’une grande image représentant la terre dans cette projection. On peut en obtenir d’autre à des résolutions différentes sur 1:10m Natural Earth I ou encore 1:10m Gray Earth mais ces images sont conséquentes. On s’inspire du code de la fonction stock_img et on écrit le code qui suit. D’autres informations sont disponibles sur github/natural-earth-vector.
import os
from matplotlib.image import imread
projection = ccrs.PlateCarree()
fig = plt.figure(figsize=(12, 6))
ax = fig.add_subplot(1, 2, 1, projection=projection)
ax.add_feature(cfeature.BORDERS.with_scale('50m'))
ax.add_feature(cfeature.LAKES.with_scale('50m'))
ax.add_feature(cfeature.LAND.with_scale('50m'))
ax.add_feature(cfeature.OCEAN.with_scale('50m'))
ax.add_feature(cfeature.RIVERS.with_scale('50m'))
ax.add_feature(cfeature.COASTLINE.with_scale('50m'))
ax.set_extent([-5, 9, 42, 52])
ax.set_title("France 50")
ax.stock_img()
ax = fig.add_subplot(1, 2, 2, projection=projection)
fname = "NE1_LR_LC.tif"
if os.path.exists(fname):
ax.imshow(imread(fname), origin='upper', transform=projection,
extent=[-180, 180, -90, 90]);
else:
import warnings
warnings.warn("L'image n'a pas été téléchargée. Lire le paragraphe qui précède.")
ax.add_feature(cfeature.BORDERS.with_scale('50m'))
ax.add_feature(cfeature.LAKES.with_scale('50m'))
ax.add_feature(cfeature.LAND.with_scale('50m'))
ax.add_feature(cfeature.OCEAN.with_scale('50m'))
ax.add_feature(cfeature.RIVERS.with_scale('50m'))
ax.add_feature(cfeature.COASTLINE.with_scale('50m'))
ax.set_extent([-5, 9, 42, 52])
ax.set_title("France 10");
c:Python372_x64libsite-packagesipykernel_launcher.py:25: UserWarning: L'image n'a pas été téléchargée. Lire le paragraphe qui précède.

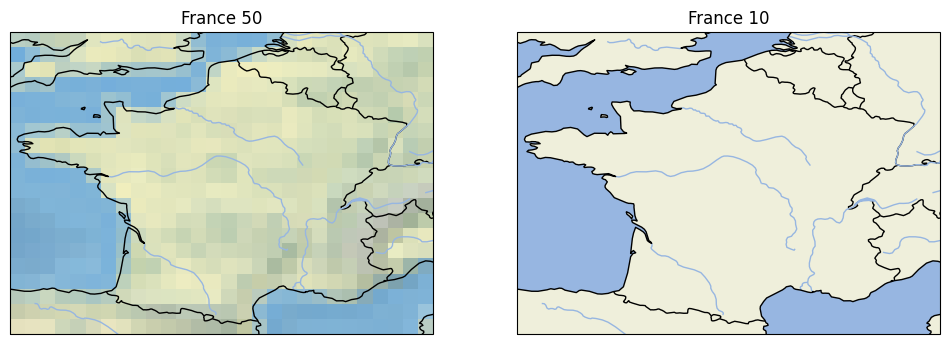
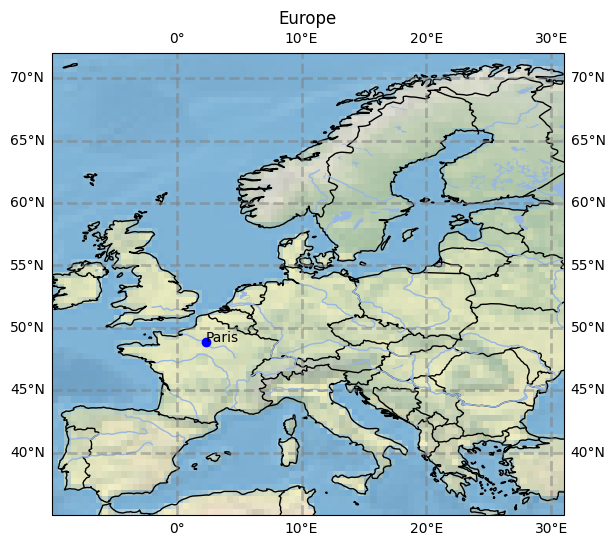
Presque parfait. Le suivant montre l’Europe et ses pays puis ajoute les méridiens et parallèles.
import cartopy.crs as ccrs
import matplotlib.pyplot as plt
import cartopy.feature as cfeature
projection = ccrs.PlateCarree()
fig = plt.figure(figsize=(12, 6))
ax = fig.add_subplot(1, 1, 1, projection=projection)
ax.add_feature(cfeature.BORDERS)
ax.add_feature(cfeature.LAKES)
ax.add_feature(cfeature.LAND)
ax.add_feature(cfeature.OCEAN)
ax.add_feature(cfeature.RIVERS)
ax.add_feature(cfeature.COASTLINE)
ax.set_extent([-10, 31, 35, 71])
ax.stock_img()
ax.set_title("Europe")
x, y = 2.3488000, 48.853410
ax.plot(x, y, 'bo', markersize=6)
ax.text(x, y, "Paris")
ax.gridlines(crs=projection, draw_labels=True,
linewidth=2, color='gray', alpha=0.5, linestyle='--');
c:Python372_x64libsite-packagescartopyio__init__.py:260: DownloadWarning: Downloading: http://naciscdn.org/naturalearth/110m/physical/ne_110m_ocean.zip warnings.warn('Downloading: {}'.format(url), DownloadWarning) c:Python372_x64libsite-packagescartopyio__init__.py:260: DownloadWarning: Downloading: http://naciscdn.org/naturalearth/110m/cultural/ne_110m_admin_0_boundary_lines_land.zip warnings.warn('Downloading: {}'.format(url), DownloadWarning) c:Python372_x64libsite-packagescartopyio__init__.py:260: DownloadWarning: Downloading: http://naciscdn.org/naturalearth/110m/physical/ne_110m_lakes.zip warnings.warn('Downloading: {}'.format(url), DownloadWarning) c:Python372_x64libsite-packagescartopyio__init__.py:260: DownloadWarning: Downloading: http://naciscdn.org/naturalearth/110m/physical/ne_110m_rivers_lake_centerlines.zip warnings.warn('Downloading: {}'.format(url), DownloadWarning) c:Python372_x64libsite-packagescartopyio__init__.py:260: DownloadWarning: Downloading: http://naciscdn.org/naturalearth/110m/physical/ne_110m_coastline.zip warnings.warn('Downloading: {}'.format(url), DownloadWarning)

Cartes avec les départements
Pour dessiner des formes sur une carte, il faut connaître les coordonnées de ces formes. La première chose à faire est de récupérer leurs données géographiques. Une fois simple de les trouver est d’utiliser un moteur de recherche avec le mot clé shapefile inclus dedans : c’est le format du fichier. shapefile france permet d’obtenir quelques sources. En voici d’autres :
GADM : database of Global Administrative Areas
OpenData.gouv commune : base de données sur data.gouv.fr
The National Map Small-Scale Collection : Etats-Unis
ArcGIS : API Javascripts
Natural Earth : Natural Earth is a public domain map dataset available at 1:10m, 1:50m, and 1:110 million scales. Featuring tightly integrated vector and raster data, with Natural Earth you can make a variety of visually pleasing, well-crafted maps with cartography or GIS software.
thematicmapping : World Borders Dataset
OpenStreetMap Data Extracts : OpenStreetMap data
OpenStreetMapData : OpenStreetMap data
Shapefile sur Wikipedia : contient divers liens vers des sources de données
La première chose à vérifier est la licence associées aux données : on ne peut pas en faire ce qu’on veut. Pour cet exemple, j’avais choisi la première source de données, GADM. La licence n’est pas précisée explicitement (on pouvait trouver happy to share sur le site, la page wikipedia GADM précise : GADM is not freely available for commercial use. The GADM project created the spatial data for many countries from spatial databases provided by national governments, NGO, and/or from maps and lists of names available on the Internet (e.g. from Wikipedia). C’est le choix que j’avais fait en 2015 mais l’accès à ces bases a probablement changé car l’accès est restreint. J’ai donc opté pour les bases accessibles depuis data.gouv.fr. Leur seul inconvénient est que les coordonnées sont exprimées dans une projection de type Lambert 93. Cela nécessite une conversion.
L’accès aux données géographiques s’est démocratisé et nombreux pays disposent maintenant d’un site mettant à disposition gratuitement ce type de données. C’est sans doute la source de données à privilégié avec notemment la description des zones administratives comme les départements, régions dont les définitions peuvent changer.
from pyensae.datasource import download_data
try:
download_data("GEOFLA_2-1_DEPARTEMENT_SHP_LAMB93_FXX_2015-12-01.7z",
website="https://wxs-telechargement.ign.fr/oikr5jryiph0iwhw36053ptm/telechargement/inspire/" + \
"GEOFLA_THEME-DEPARTEMENTS_2015_2$GEOFLA_2-1_DEPARTEMENT_SHP_LAMB93_FXX_2015-12-01/file/")
except Exception as e:
# au cas le site n'est pas accessible
download_data("GEOFLA_2-1_DEPARTEMENT_SHP_LAMB93_FXX_2015-12-01.7z", website="xd")
from pyquickhelper.filehelper import un7zip_files
try:
un7zip_files("GEOFLA_2-1_DEPARTEMENT_SHP_LAMB93_FXX_2015-12-01.7z", where_to="shapefiles")
departements = 'shapefiles/GEOFLA_2-1_DEPARTEMENT_SHP_LAMB93_FXX_2015-12-01/GEOFLA/1_DONNEES_LIVRAISON_2015/' + \
'GEOFLA_2-1_SHP_LAMB93_FR-ED152/DEPARTEMENT/DEPARTEMENT.shp'
except FileNotFoundError as e:
# Il est possible que cette instruction ne fonctionne pas.
# Dans ce cas, on prendra une copie de ce fichier.
import warnings
warnings.warn("Plan B parce que " + str(e))
download_data("DEPARTEMENT.zip")
departements = "DEPARTEMENT.shp"
if not os.path.exists(departements):
raise FileNotFoundError("Impossible de trouver '{0}'\ncurrent folder: '{1}'".format(
departements, os.getcwd()))
La license accompagne les données : ce produit est téléchargeable et utilisable gratuitement sous licence Etalab. Pour un usage commercial, il faut faire attentation à la license associée aux données. Le seul inconvénient des données GEOFLA est que certaines sont données dans le système de coordonnées Lambert 93 (voir aussi Cartographie avec R).
shp = departements
import shapefile
r = shapefile.Reader(shp)
shapes = r.shapes()
records = r.records()
len(shapes), len(records)
(96, 96)
r.shpLength, r.numRecords
(3134040, 96)
r.bbox
[99217.1, 6049646.300000001, 1242417.2, 7110480.100000001]
r.shapeType
5
On regarde une zone en particulier mais on réduit la quantité de données affichées :
d = shapes[0].__dict__.copy()
d["points"] = d["points"][:10]
d
{'shapeType': 5,
'points': [(701742.0, 6751181.100000001),
(701651.9, 6751166.9),
(701552.0, 6751162.7),
(700833.7000000001, 6751313.7),
(700669.4, 6751380.0),
(700475.4, 6751476.600000001),
(700400.7000000001, 6751517.2),
(700098.3, 6751789.600000001),
(699993.8, 6751845.4),
(699874.1000000001, 6751876.4)],
'parts': [0],
'bbox': [688654.4, 6690595.300000001, 800332.3, 6811114.5]}
records[0]
Record #0: ['DEPARTEM0000000000000004', '89', 'YONNE', '024', 'AUXERRE', 742447, 6744261, 748211, 6750855, '27', 'BOURGOGNE-FRANCHE-COMTE']
J’utilise une fonction de conversion des coordonnées récupérée sur Internet.
import math
def lambert932WGPS(lambertE, lambertN):
class constantes:
GRS80E = 0.081819191042816
LONG_0 = 3
XS = 700000
YS = 12655612.0499
n = 0.7256077650532670
C = 11754255.4261
delX = lambertE - constantes.XS
delY = lambertN - constantes.YS
gamma = math.atan(-delX / delY)
R = math.sqrt(delX * delX + delY * delY)
latiso = math.log(constantes.C / R) / constantes.n
sinPhiit0 = math.tanh(latiso + constantes.GRS80E * math.atanh(constantes.GRS80E * math.sin(1)))
sinPhiit1 = math.tanh(latiso + constantes.GRS80E * math.atanh(constantes.GRS80E * sinPhiit0))
sinPhiit2 = math.tanh(latiso + constantes.GRS80E * math.atanh(constantes.GRS80E * sinPhiit1))
sinPhiit3 = math.tanh(latiso + constantes.GRS80E * math.atanh(constantes.GRS80E * sinPhiit2))
sinPhiit4 = math.tanh(latiso + constantes.GRS80E * math.atanh(constantes.GRS80E * sinPhiit3))
sinPhiit5 = math.tanh(latiso + constantes.GRS80E * math.atanh(constantes.GRS80E * sinPhiit4))
sinPhiit6 = math.tanh(latiso + constantes.GRS80E * math.atanh(constantes.GRS80E * sinPhiit5))
longRad = math.asin(sinPhiit6)
latRad = gamma / constantes.n + constantes.LONG_0 / 180 * math.pi
longitude = latRad / math.pi * 180
latitude = longRad / math.pi * 180
return longitude, latitude
lambert932WGPS(99217.1, 6049646.300000001), lambert932WGPS(1242417.2, 7110480.100000001)
((-4.1615802638173065, 41.303505287589545),
(10.699505053975292, 50.85243395553585))
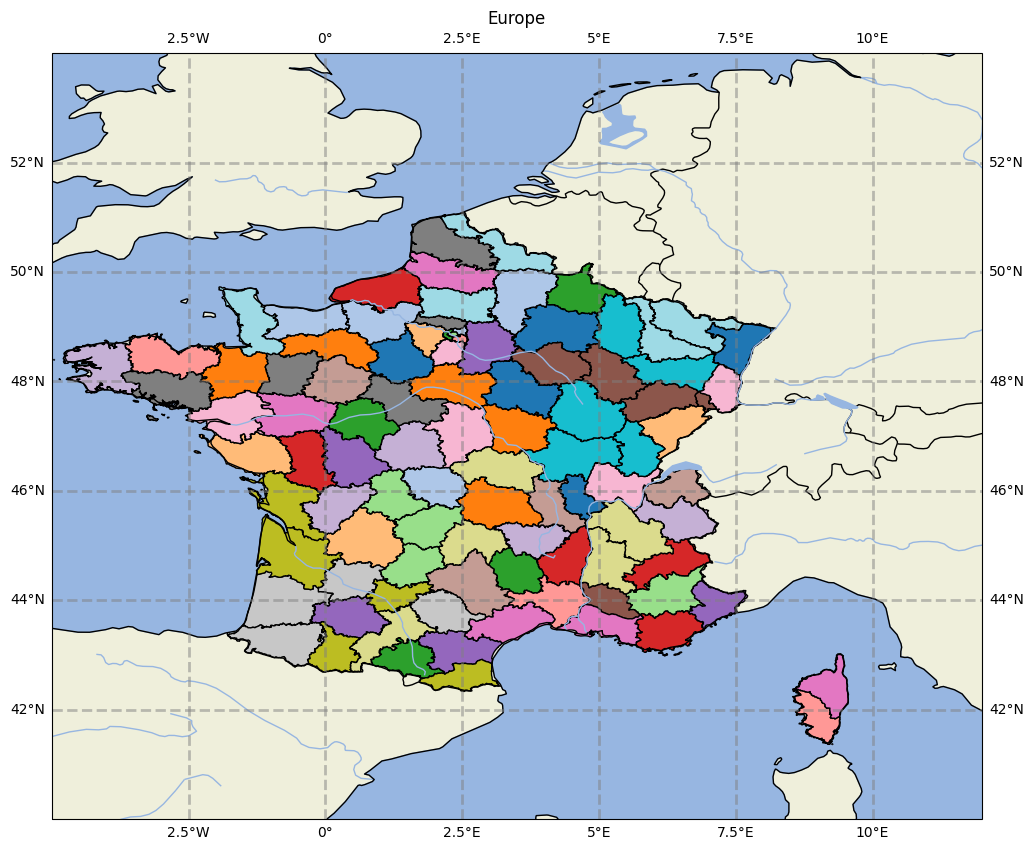
Après plusieurs recherches sur internet, un grand nombre, on aboutit à la carte suivante non sans avoir redéfini des contours et frontières plus précis inspiré du code feature.py.
from cartopy.feature import NaturalEarthFeature, COLORS
resolution = "50m"
BORDERS = NaturalEarthFeature('cultural', 'admin_0_boundary_lines_land',
resolution, edgecolor='black', facecolor='none')
STATES = NaturalEarthFeature('cultural', 'admin_1_states_provinces_lakes',
resolution, edgecolor='black', facecolor='none')
COASTLINE = NaturalEarthFeature('physical', 'coastline', resolution,
edgecolor='black', facecolor='none')
LAKES = NaturalEarthFeature('physical', 'lakes', resolution,
edgecolor='face',
facecolor=COLORS['water'])
LAND = NaturalEarthFeature('physical', 'land', resolution,
edgecolor='face',
facecolor=COLORS['land'], zorder=-1)
OCEAN = NaturalEarthFeature('physical', 'ocean', resolution,
edgecolor='face',
facecolor=COLORS['water'], zorder=-1)
RIVERS = NaturalEarthFeature('physical', 'rivers_lake_centerlines', resolution,
edgecolor=COLORS['water'],
facecolor='none')
import cartopy.crs as ccrs
import matplotlib.pyplot as plt
projection = ccrs.PlateCarree()
fig = plt.figure(figsize=(12, 12))
ax = fig.add_subplot(1, 1, 1, projection=projection)
ax.add_feature(BORDERS)
ax.add_feature(LAKES)
ax.add_feature(LAND)
ax.add_feature(OCEAN)
ax.add_feature(RIVERS)
ax.add_feature(COASTLINE)
ax.set_extent([-5, 12, 40, 54])
ax.set_title("Europe")
ax.gridlines(crs=projection, draw_labels=True,
linewidth=2, color='gray', alpha=0.5, linestyle='--')
from matplotlib.collections import LineCollection
import shapefile
import geopandas
from shapely.geometry import Polygon
from shapely.ops import cascaded_union, unary_union
shp = departements
r = shapefile.Reader(shp)
shapes = r.shapes()
records = r.records()
polys = []
for i, (record, shape) in enumerate(zip(records, shapes)):
# les coordonnées sont en Lambert 93
if i == 0:
print(record, shape.parts)
geo_points = [lambert932WGPS(x,y) for x, y in shape.points]
if len(shape.parts) == 1:
# Un seul polygone
poly = Polygon(geo_points)
else:
# Il faut les fusionner.
ind = list(shape.parts) + [len(shape.points)]
pols = [Polygon(geo_points[ind[i]:ind[i+1]]) for i in range(0, len(shape.parts))]
try:
poly = unary_union(pols)
except Exception as e:
print("Cannot merge: ", record)
print([_.length for _ in pols], ind)
poly = Polygon(geo_points)
polys.append(poly)
data = geopandas.GeoDataFrame(geometry=polys)
# cmap -> voir https://matplotlib.org/users/colormaps.html
data.plot(ax=ax, cmap='tab20', edgecolor='black');
# Ou pour définir des couleurs spécifiques.
# geopandas.plotting.plot_polygon_collection(ax, data['geometry'], facecolor=data['colors'], values=None)
Record #0: ['DEPARTEM0000000000000004', '89', 'YONNE', '024', 'AUXERRE', 742447, 6744261, 748211, 6750855, '27', 'BOURGOGNE-FRANCHE-COMTE'] [0]

Cartes interactives
La vidéo Spatial data and web mapping with Python vous en dira un peu plus sur la cartographie. Lorsqu’on dessine une carte avec les rues d’une ville, on veut pouvoir zoomer et dézoomer facilement pour avoir une vue d’ensemble ou une vue détaillé. Dans ce cas là, il faut utiliser un service externe telle que Gmap API, Bing Map API, Yahoo Map API ou OpenStreetMap qui est une version open source. Dans tous les cas, il faut faire attention si les données que vous manipulez dans la mesure où elles transitent par un service externe. L’article Busy areas in Paris est un exemple d’utilisation d’OpenStreetMap. Ce qu’on cherche avant tout, c’est un graphique interactif. Il existe des modules qui permettent d’utiliser ces services directement depuis un notebook python.
Le module folium insert du javascript dans le notebook lui-même. Voici un exemple construit à partir de ce module : Creating Interactive Election Maps Using folium and IPython Notebooks. Il est prévu pour fonctionner comme suit. D’abord, une étape d’initialisation :
import folium
Et si elle fonctionne (un jour peut-être), la suite devrait être :
map_osm = folium.Map(location=[48.85, 2.34])
map_osm
Donc, on prend un raccourci et on en profite pour ajouter un triangle à l’emplacement de l’ENSAE :
import folium
map_osm = folium.Map(location=[48.711478,2.207708])
from pyensae.notebookhelper import folium_html_map
map_osm.add_child(folium.RegularPolygonMarker(location=[48.711478,2.207708], popup='ENSAE',
fill_color='#132b5e', radius=10))
from IPython.display import HTML
#HTML(folium_html_map(map_osm))
map_osm
Un moteur de recherche vous donnera rapidement quelques exemples de cartes utilisant ce module : Folium Polygon Markers, Easy interactive maps with folium, Plotting shapefiles with cartopy and folium.